| Start Page |
|
 |
| Start Page |
|
|
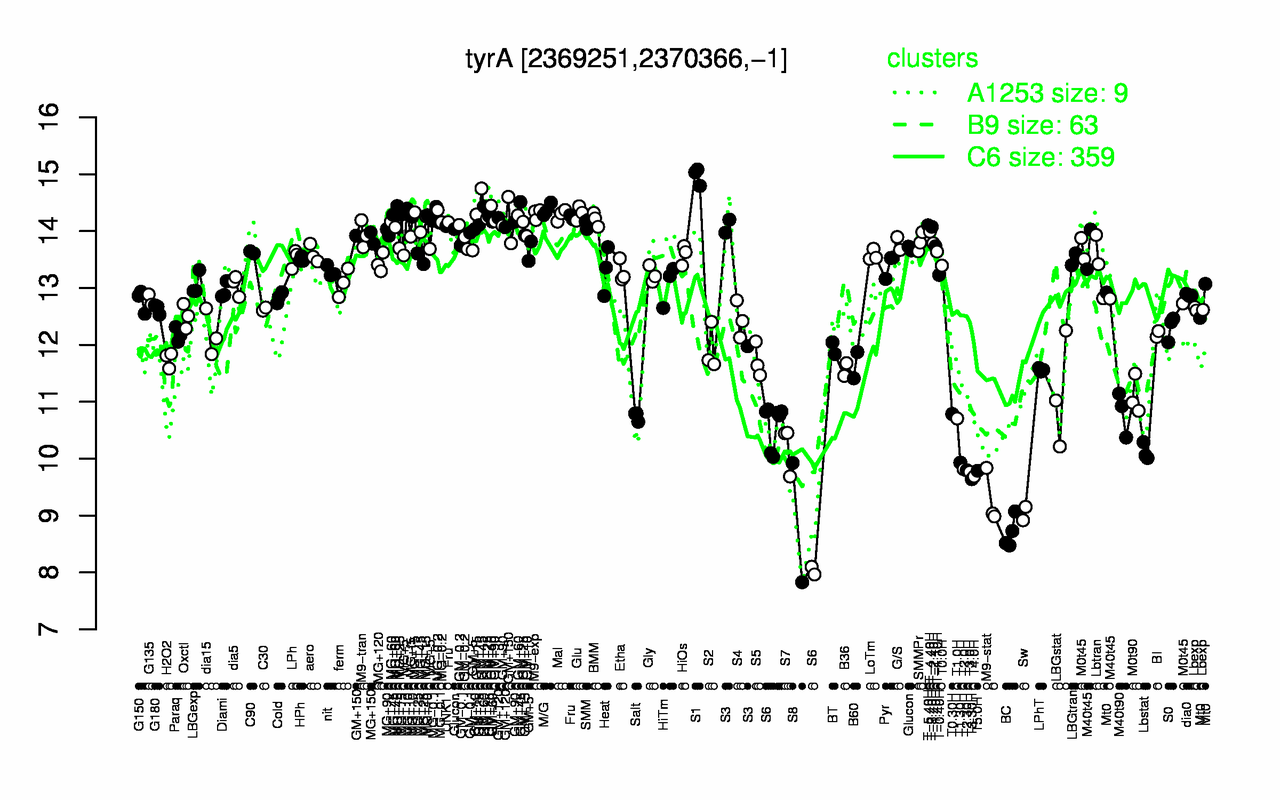
| S1 | GM+45 | M/G | Glu | MG+10 | M9-exp | MG+15 | GM+60 | Mal | MG-0.2 |
| 15 | 14.6 | 14.4 | 14.3 | 14.3 | 14.3 | 14.3 | 14.3 | 14.3 | 14.3 |
| BC | S8 | Sw | M9-stat | T3.30H | T4.0H | T3.0H | T5.0H | T2.30H | T2.0H |
| 8.7 | 8.88 | 9.03 | 9.29 | 9.64 | 9.69 | 9.77 | 9.79 | 9.8 | 9.82 |