B. subtilis Expression Data Browser
Details about pdxT Show/Hide
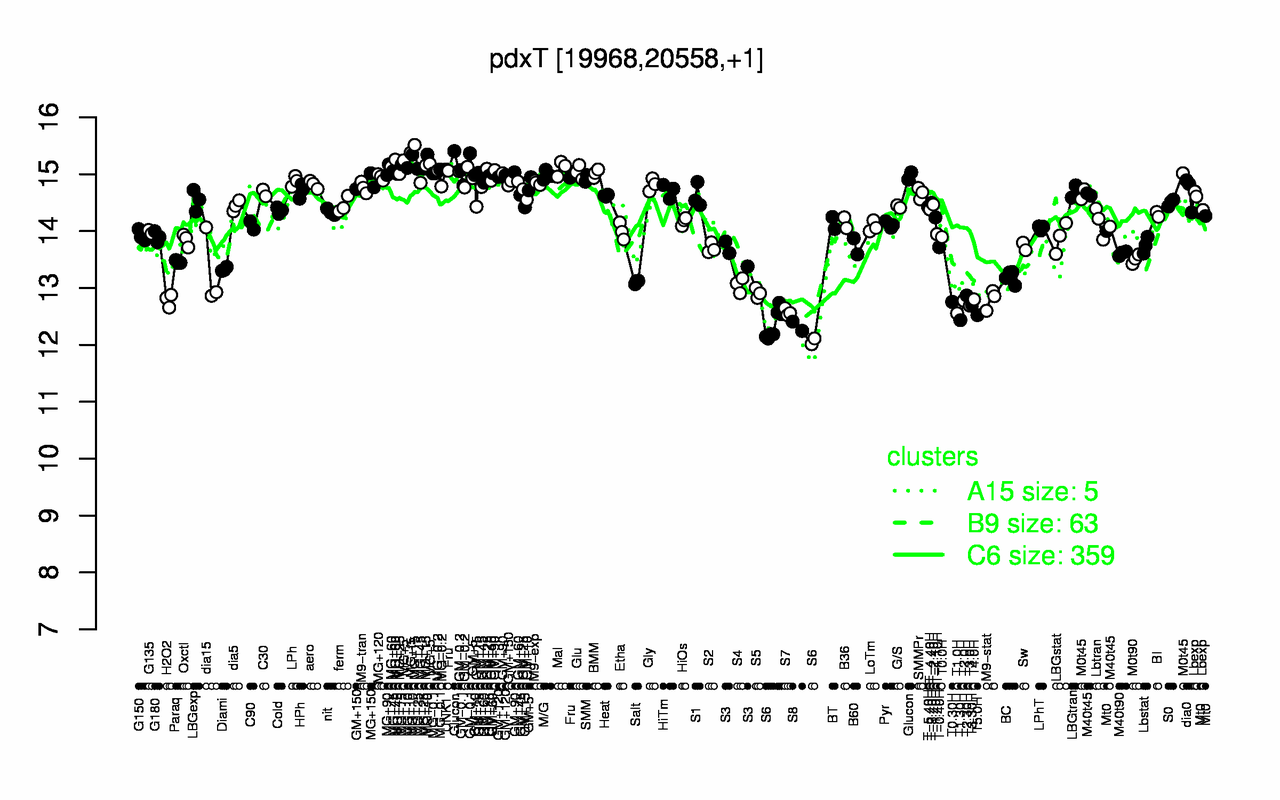
Highest Expression Conditions
MG+t5 MG+15 MG+10 MG+5 MG+60 Glucon Mal UNK1 GM-0.1 MG+90
15.4 15.3 15.3 15.2 15.2 15.1 15.1 15.1 15.1 15.1
Lowest Expression Conditions
S6 S8 T1.30H T5.0H T1.0H S7 T3.0H T3.30H T0.30H T2.0H
12.3 12.3 12.4 12.5 12.6 12.6 12.7 12.7 12.8 12.8
Most Positively Correlated Segments
pdxS glyA purT purB purS purK purN purM aroE purC
0.97 0.88 0.87 0.87 0.87 0.87 0.87 0.86 0.86 0.86
Most Negatively Correlated Segments
spoIISA ypeP S830 S1087 acdA S609 sspH S463 abnA ywcA
-0.81 -0.81 -0.8 -0.77 -0.76 -0.75 -0.75 -0.75 -0.75 -0.75
Expression Profile of Segment pdxT Show/Hide
Annotation of Gene pdxT Show/Hide
function
16.2: Construct biomass (Anabolism)
inference
ab initio prediction:AMIGene:2.0
codon_start
1
EC_number
4.-.-.-
transl_table
11
note
Evidence 1a: Function experimentally demonstrated in the studied strain; PubMedId: 14762015, 15771487; Product type e: enzyme
db_xref
GI:2632279
product
glutamine amidotransferase for pyridoxal phosphate synthesis
protein_id
CAB11788.1
Genomic View of Gene/Segment pdxT Show/Hide
(Legend)