| Start Page |
|
 |
| Start Page |
|
|
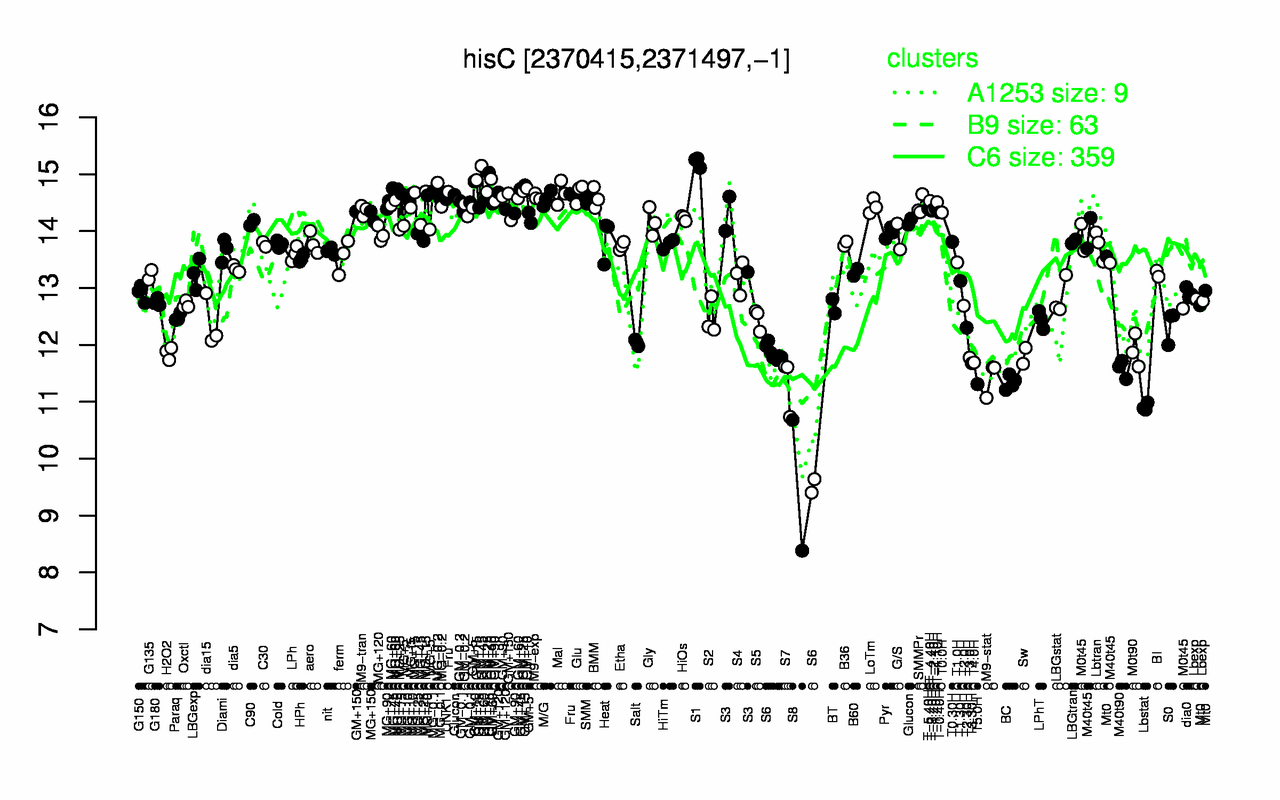
| S1 | GM+45 | GM+15 | GM+10 | MG+15 | Mal | Glu | Fru | MG-0.1 | MG-0.2 |
| 15.2 | 14.9 | 14.9 | 14.8 | 14.7 | 14.7 | 14.7 | 14.7 | 14.6 | 14.6 |
| S8 | Lbstat | T5.0H | S7 | BC | S6 | M9-stat | M40t90 | T3.30H | T4.0H |
| 9.53 | 10.9 | 11.3 | 11.3 | 11.3 | 11.3 | 11.4 | 11.6 | 11.7 | 11.7 |