| Start Page |
|
 |
| Start Page |
|
|
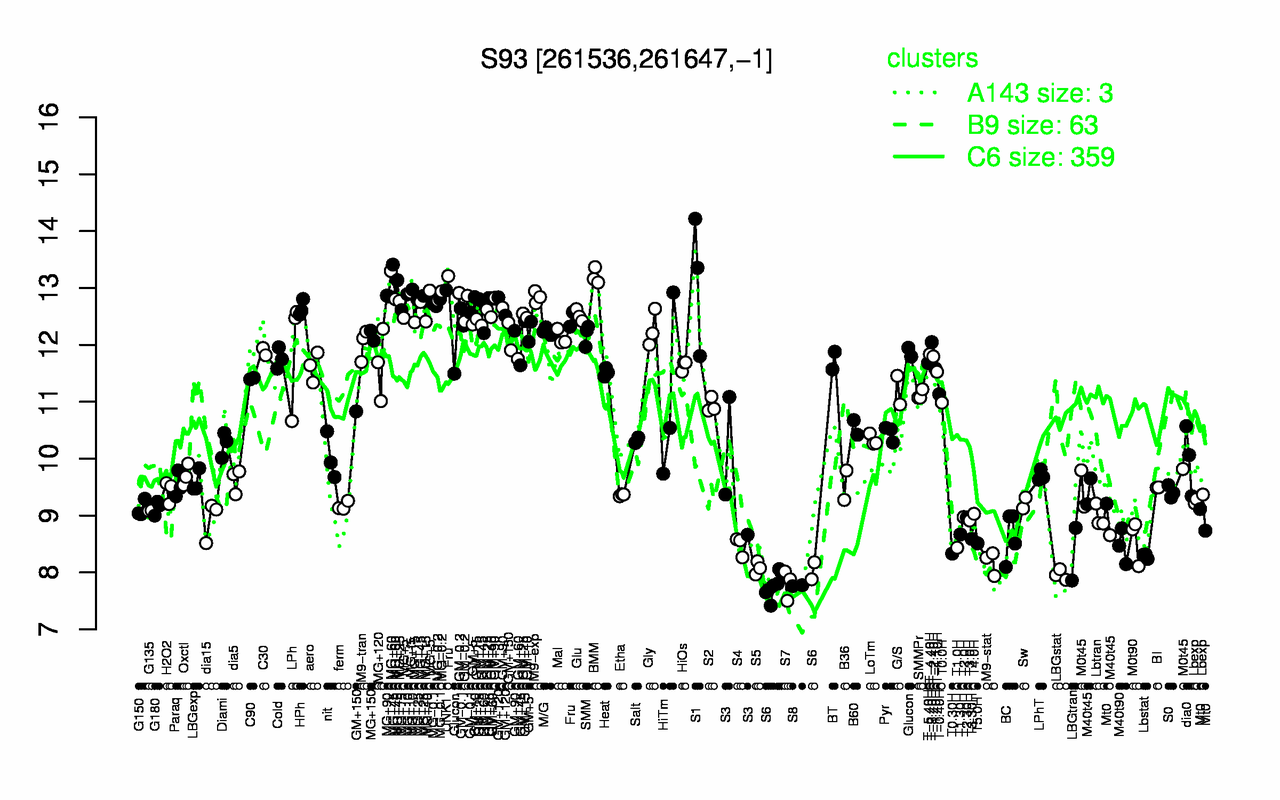
| BMM | S1 | MG+45 | MG+60 | UNK1 | MG+t5 | MG+10 | MG+90 | MG-0.2 | M9-exp |
| 13.2 | 13.1 | 13.1 | 13.1 | 13 | 12.9 | 12.9 | 12.9 | 12.9 | 12.8 |
| S8 | S7 | S6 | LBGstat | S5 | M9-stat | Lbstat | LBGtran | T0.30H | T1.0H |
| 7.77 | 7.8 | 7.83 | 7.96 | 8.08 | 8.18 | 8.29 | 8.32 | 8.33 | 8.43 |