| Start Page |
|
 |
| Start Page |
|
|
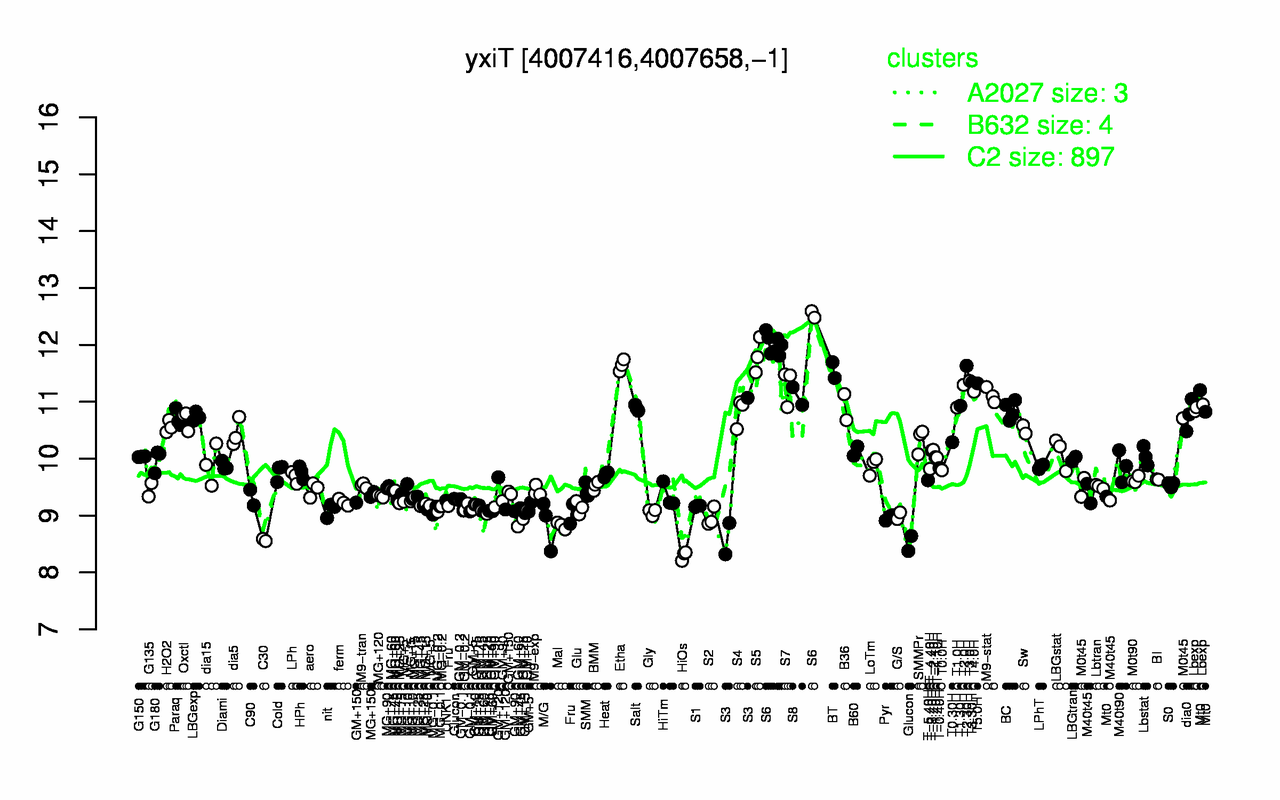
| S6 | S5 | Etha | T2.30H | BT | T3.0H | T3.30H | T5.0H | T2.0H | S7 |
| 12.1 | 11.8 | 11.6 | 11.6 | 11.6 | 11.4 | 11.3 | 11.3 | 11.3 | 11.3 |
| HiOs | C30 | Glucon | Mal | M/G | S2 | Pyr | GM+60 | G/S | GM+25 |
| 8.3 | 8.57 | 8.77 | 8.82 | 8.86 | 8.97 | 8.97 | 8.99 | 9 | 9.05 |