| Start Page |
|
 |
| Start Page |
|
|
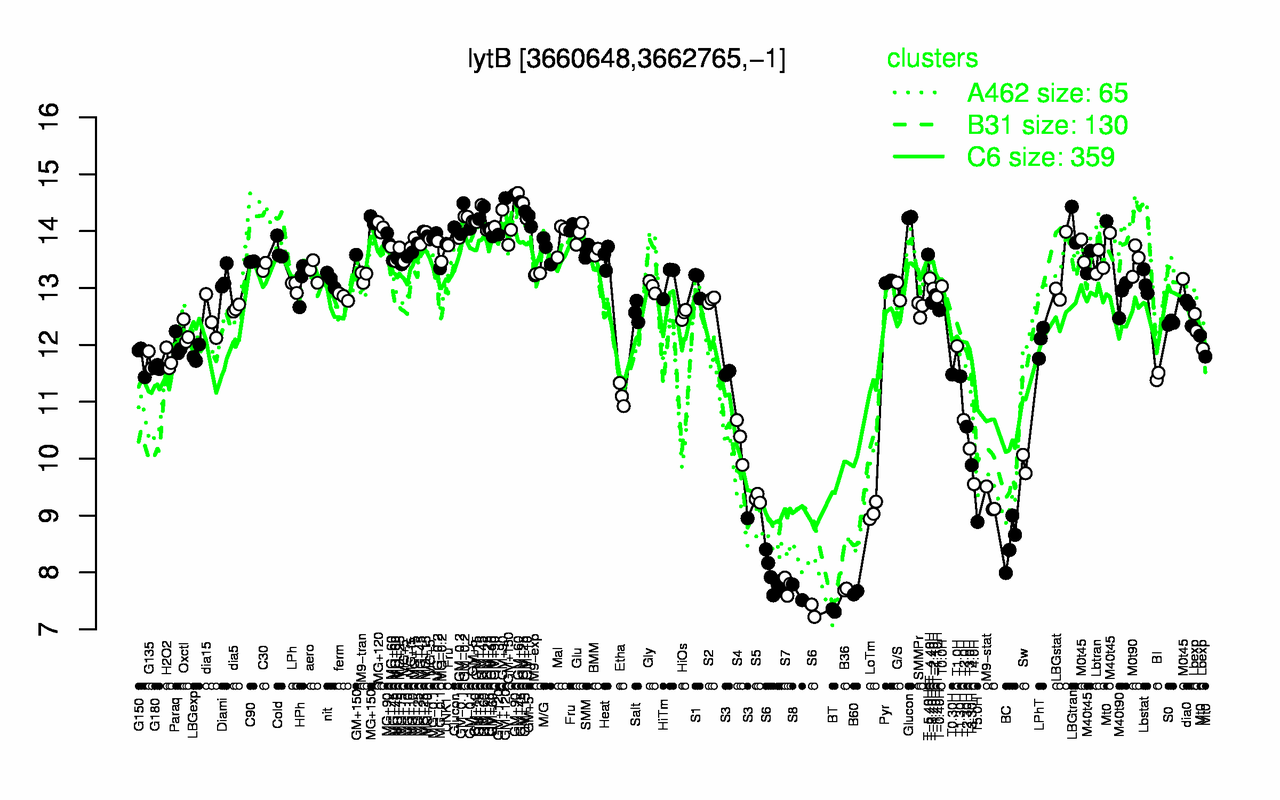
| GM+90 | GM+60 | GM+45 | GM+120 | GM+25 | GM+10 | MG+150 | Glucon | GM+15 | GM+5 |
| 14.4 | 14.3 | 14.3 | 14.3 | 14.2 | 14.2 | 14.2 | 14.2 | 14.2 | 14.2 |
| BT | B60 | S8 | B36 | S7 | S6 | BC | T5.0H | LoTm | M9-stat |
| 7.33 | 7.64 | 7.65 | 7.7 | 7.77 | 7.79 | 8.51 | 8.89 | 9.07 | 9.25 |