| Start Page |
|
 |
| Start Page |
|
|
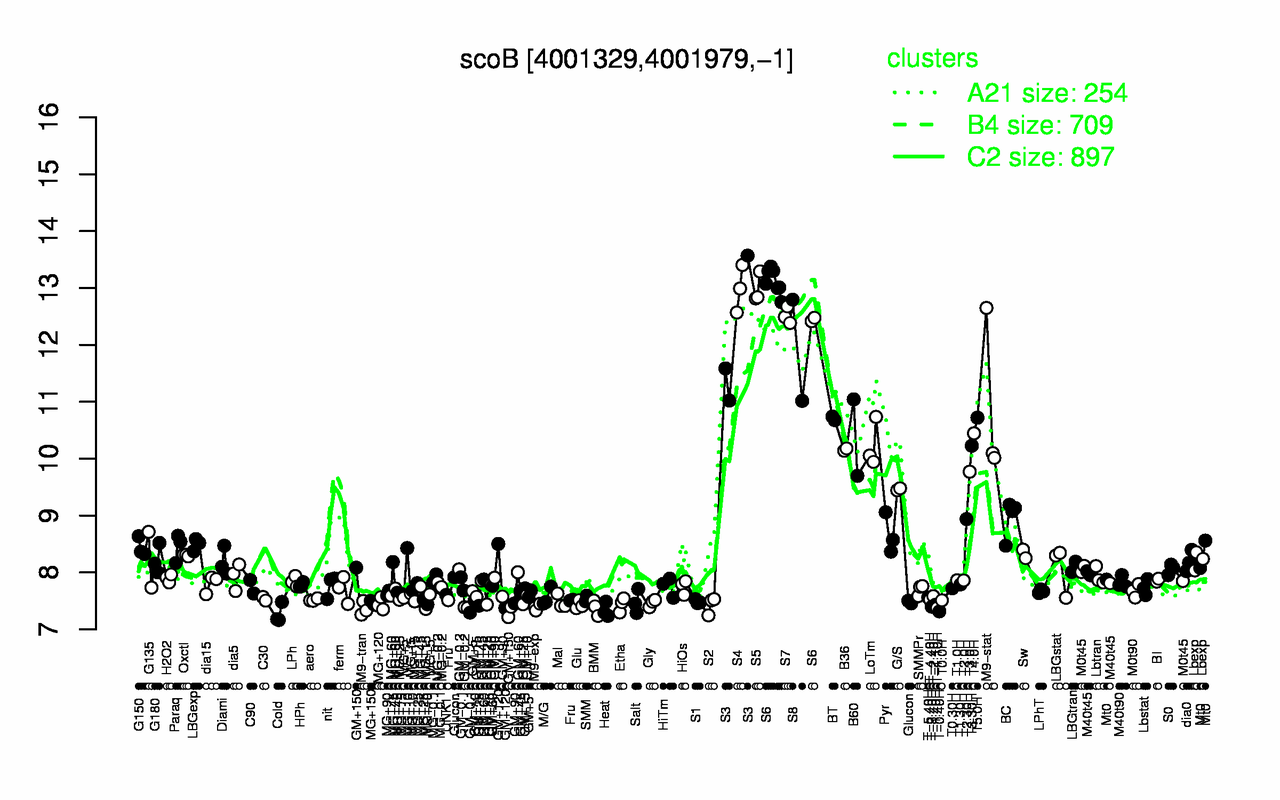
| S4 | S5 | S6 | S7 | S3 | S8 | M9-stat | T5.0H | BT | T4.0H |
| 13 | 13 | 13 | 12.5 | 12.1 | 11.9 | 10.9 | 10.7 | 10.7 | 10.4 |
| Cold | T-0.40H | Heat | M9-tran | T-1.10H | BMM | M9-exp | T-3.40H | S2 | GM+25 |
| 7.27 | 7.32 | 7.34 | 7.36 | 7.38 | 7.38 | 7.39 | 7.4 | 7.43 | 7.43 |