| Start Page |
|
 |
| Start Page |
|
|
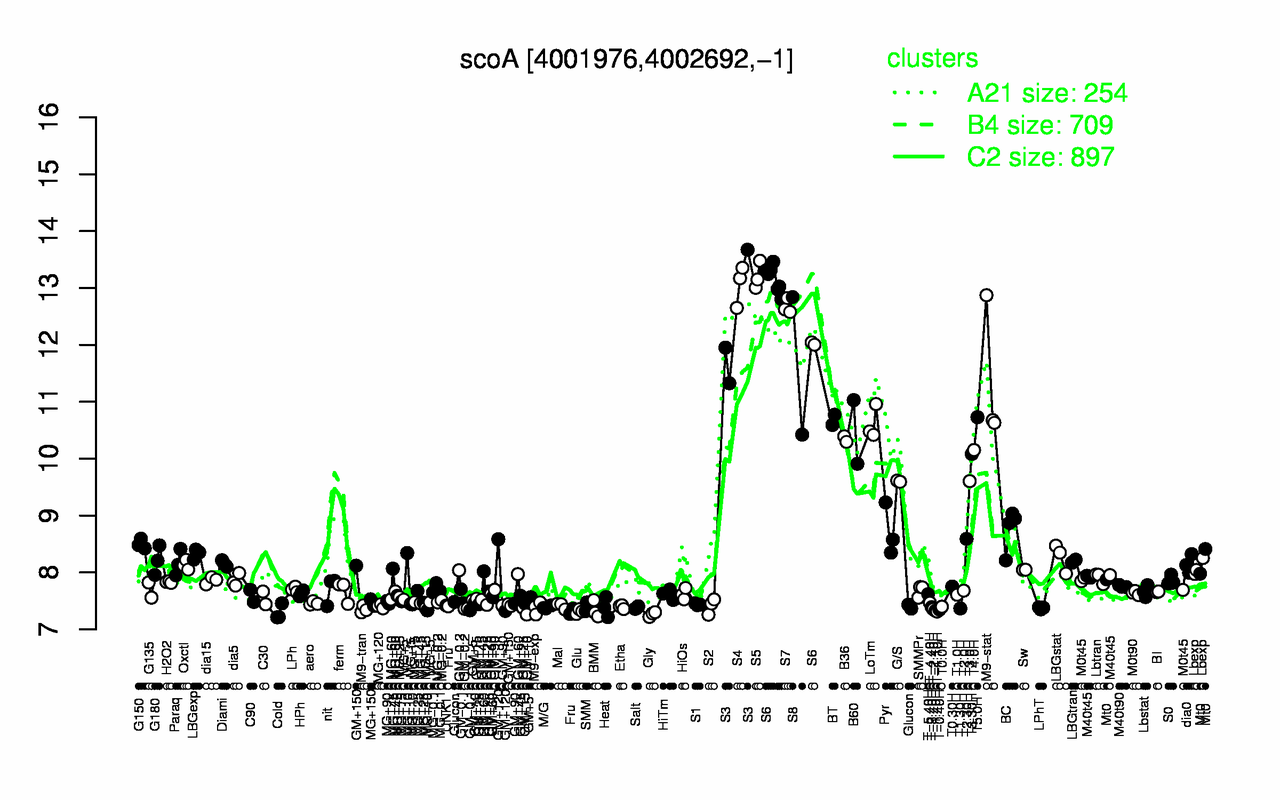
| S5 | S4 | S6 | S7 | S3 | S8 | M9-stat | T5.0H | BT | LoTm |
| 13.2 | 13.1 | 12.9 | 12.7 | 12.3 | 11.6 | 11.4 | 10.7 | 10.7 | 10.6 |
| Gly | Cold | T-1.10H | Glu | T-1.40H | BMM | T-0.40H | Fru | M9-tran | T-2.40H |
| 7.27 | 7.29 | 7.31 | 7.31 | 7.33 | 7.34 | 7.34 | 7.35 | 7.35 | 7.36 |