| Start Page |
|
 |
| Start Page |
|
|
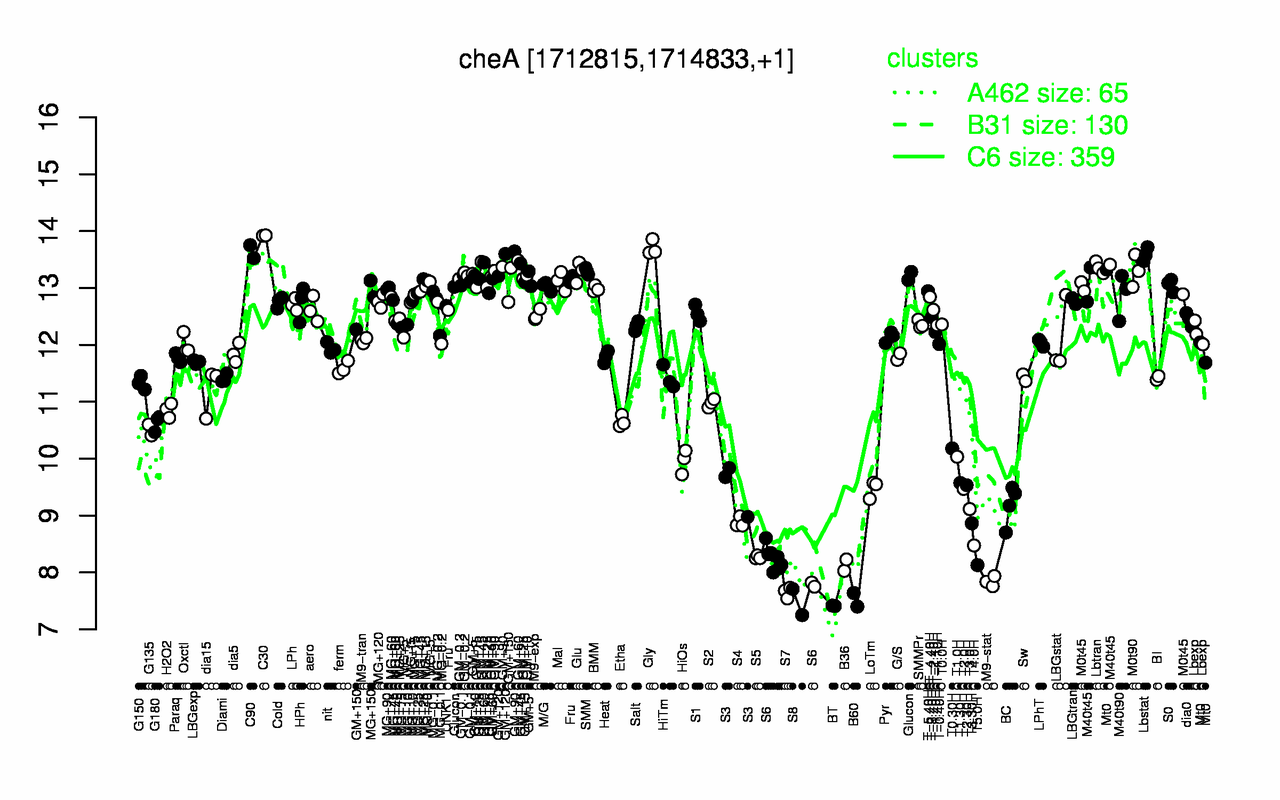
| C30 | Gly | C90 | Lbstat | GM+90 | GM+120 | GM+60 | GM+45 | Lbtran | M0t90 |
| 13.9 | 13.7 | 13.6 | 13.6 | 13.4 | 13.4 | 13.4 | 13.4 | 13.4 | 13.3 |
| BT | S8 | B60 | S7 | M9-stat | B36 | T5.0H | S6 | S5 | T4.0H |
| 7.41 | 7.48 | 7.52 | 7.65 | 7.84 | 8.13 | 8.13 | 8.15 | 8.27 | 8.47 |