| Start Page |
|
 |
| Start Page |
|
|
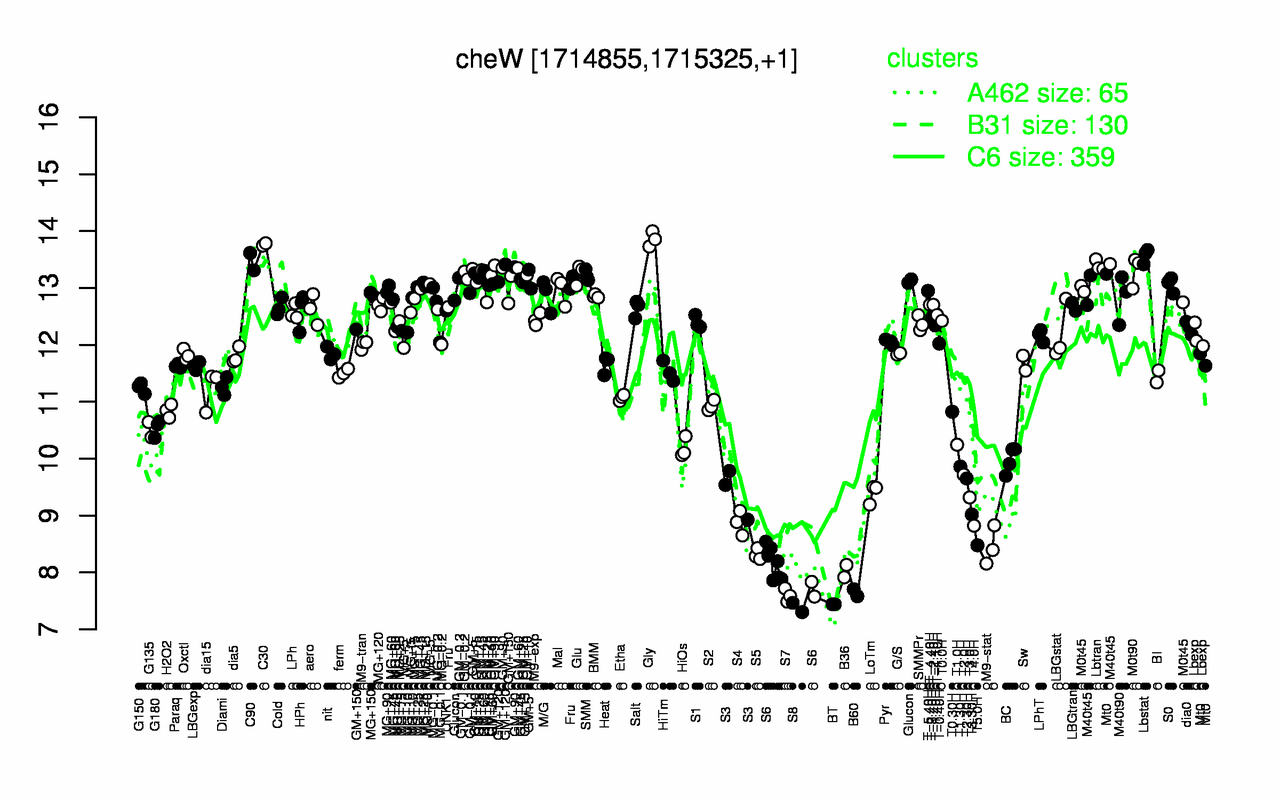
| Gly | C30 | Lbstat | C90 | Lbtran | GM+90 | M0t90 | GM+120 | Glu | GM+10 |
| 13.9 | 13.8 | 13.6 | 13.5 | 13.4 | 13.4 | 13.3 | 13.3 | 13.2 | 13.2 |
| S8 | BT | S7 | B60 | B36 | S6 | S5 | M9-stat | T5.0H | T4.0H |
| 7.38 | 7.44 | 7.6 | 7.64 | 8.02 | 8.06 | 8.32 | 8.46 | 8.48 | 8.82 |