| Start Page |
|
 |
| Start Page |
|
|
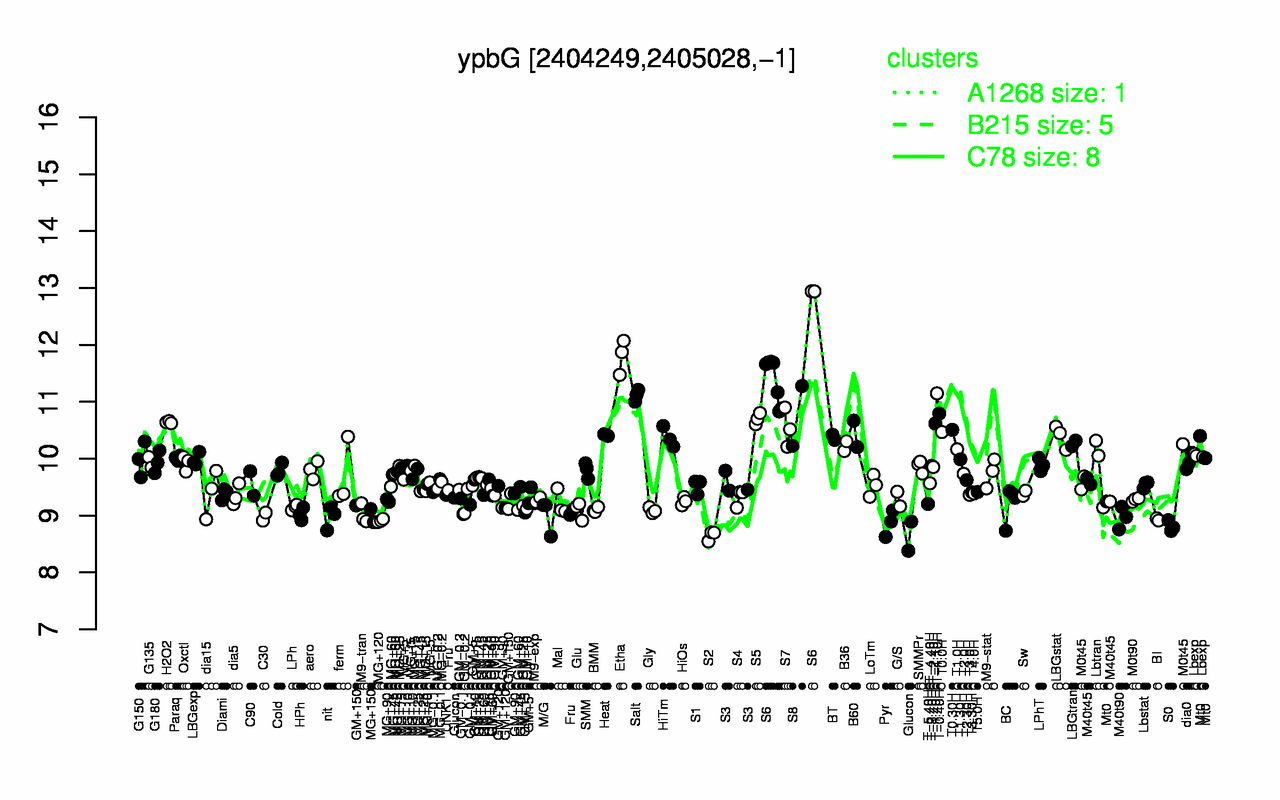
| Etha | S6 | T-1.10H | Salt | T-0.40H | S8 | S5 | H2O2 | T-1.40H | S7 |
| 11.8 | 11.7 | 11.1 | 11.1 | 10.8 | 10.8 | 10.7 | 10.6 | 10.6 | 10.5 |
| S2 | S0 | Glucon | Pyr | MG+120 | BI | M40t90 | nit | C30 | MG+150 |
| 8.65 | 8.81 | 8.86 | 8.87 | 8.91 | 8.93 | 8.96 | 8.97 | 8.98 | 9 |