| Start Page |
|
 |
| Start Page |
|
|
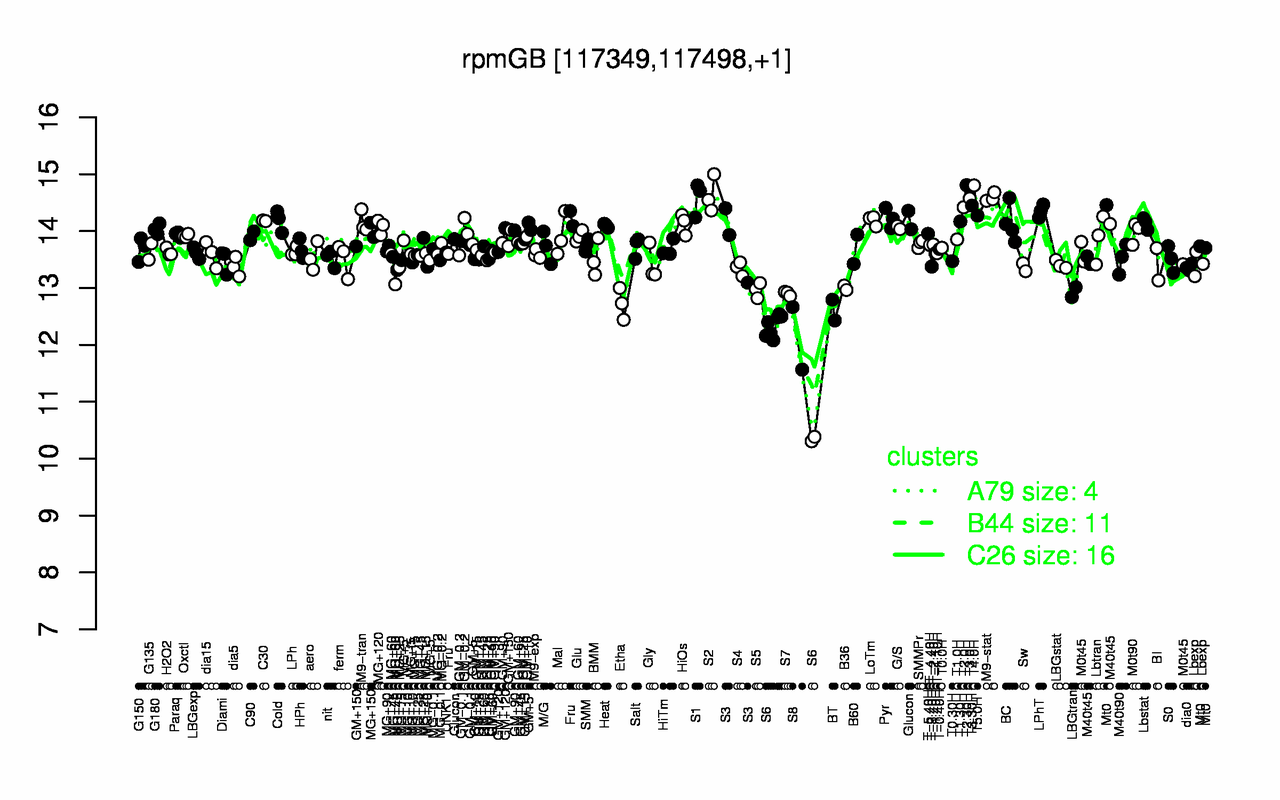
| T2.30H | T4.0H | S2 | M9-stat | S1 | T3.0H | T3.30H | T2.0H | LPhT | T5.0H |
| 14.8 | 14.8 | 14.6 | 14.6 | 14.6 | 14.6 | 14.5 | 14.4 | 14.4 | 14.3 |
| S6 | S8 | BT | Etha | S7 | LBGtran | S5 | B36 | MG+60 | S4 |
| 11.9 | 12.1 | 12.6 | 12.7 | 12.9 | 12.9 | 13 | 13 | 13.3 | 13.3 |