B. subtilis Expression Data Browser
Details about S560 Show/Hide
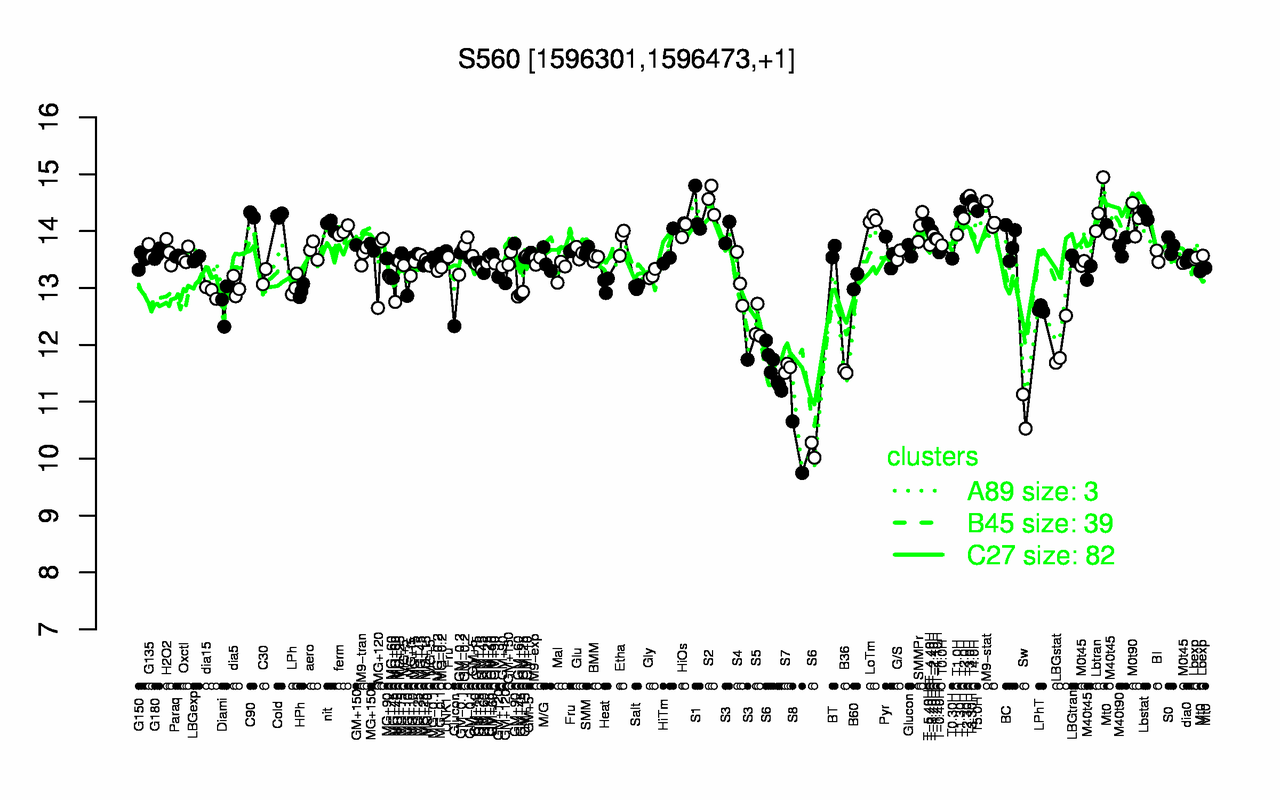
Highest Expression Conditions
T3.0H T2.30H S2 T3.30H Lbtran T4.0H T5.0H T1.30H S1 Lbstat
14.6 14.6 14.5 14.5 14.4 14.4 14.4 14.3 14.3 14.3
Lowest Expression Conditions
S8 Sw S6 B36 S7 LBGstat S5 LPhT Diami dia15
10.2 10.8 11.3 11.5 11.6 12 12.4 12.6 12.7 12.9
Most Positively Correlated Segments
ftsA S628 ybaJ S1564 ynaF S1047 yokI comN ynaE S629
0.93 0.81 0.8 0.79 0.79 0.79 0.79 0.78 0.78 0.78
Most Negatively Correlated Segments
ywbA S425 S1280 yueG S1197 yvnB ykzH S1178 S984 ytdA
-0.73 -0.73 -0.73 -0.72 -0.71 -0.71 -0.7 -0.69 -0.69 -0.69
Expression Profile of Segment S560 Show/Hide
Genomic View of Gene/Segment S560 Show/Hide
(Legend)