B. subtilis Expression Data Browser
Start Page
B. subtilis Expression Data Browser
Gene/Segment:
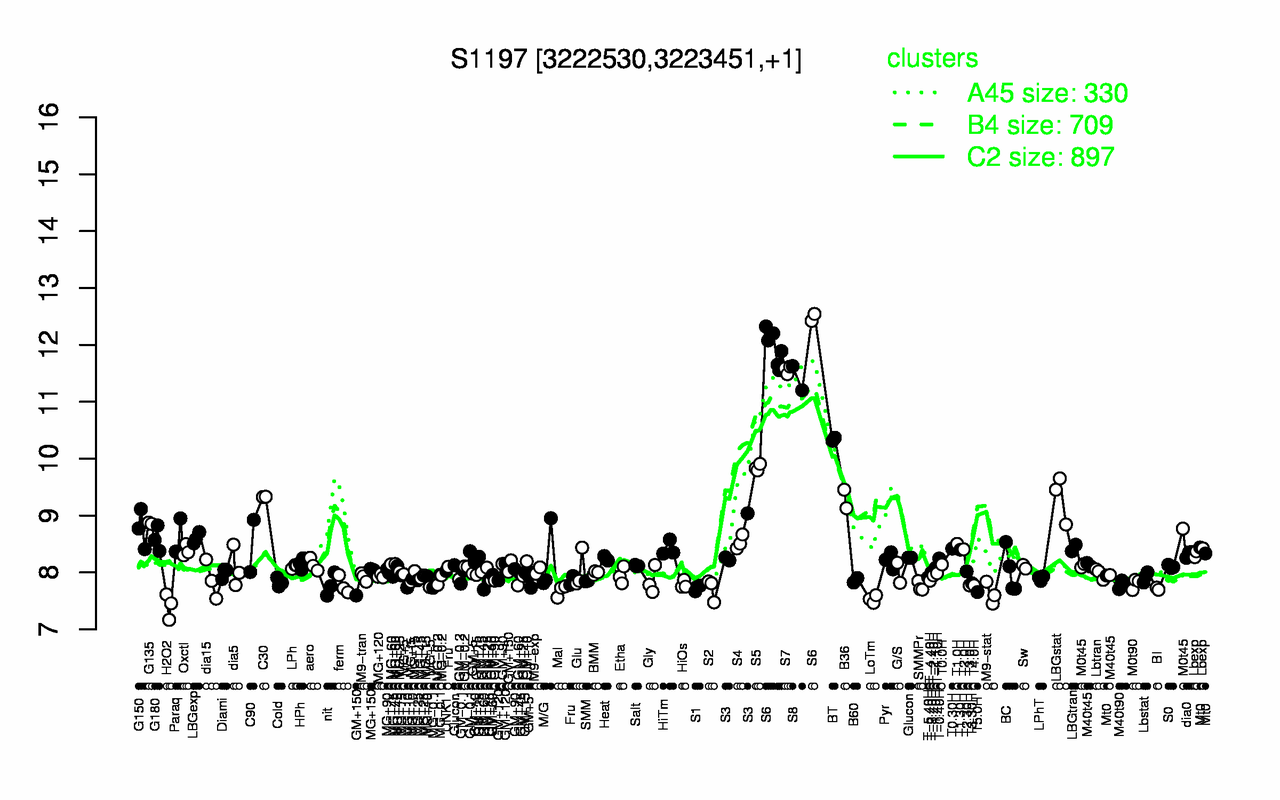
S1197
Locus Tag:
new_3222530_3223451
Details about S1197
Show/Hide
Highest Expression Conditions
S6
S7
S8
BT
S5
C30
LBGstat
B36
G135
G150
12.1
11.6
11.4
10.3
9.84
9.33
9.32
9.29
8.87
8.77
Lowest Expression Conditions
H2O2
LoTm
M9-stat
T5.0H
Mal
S2
BI
S1
SMMPr
T3.0H
7.41
7.53
7.63
7.66
7.68
7.71
7.71
7.73
7.75
7.77
Most Positively Correlated Segments
S1191
S268
S349
S81
S1083
S379
S982
yqaN
S751
S1188
0.93
0.93
0.93
0.93
0.93
0.92
0.92
0.92
0.92
0.92
Most Negatively Correlated Segments
S511
ykuH
yusH
yobK
S607
ptkA
yobL
parA
ftsA
S1189
-0.81
-0.81
-0.81
-0.8
-0.8
-0.79
-0.79
-0.79
-0.78
-0.78
Expression Profile of Segment S1197
Show/Hide
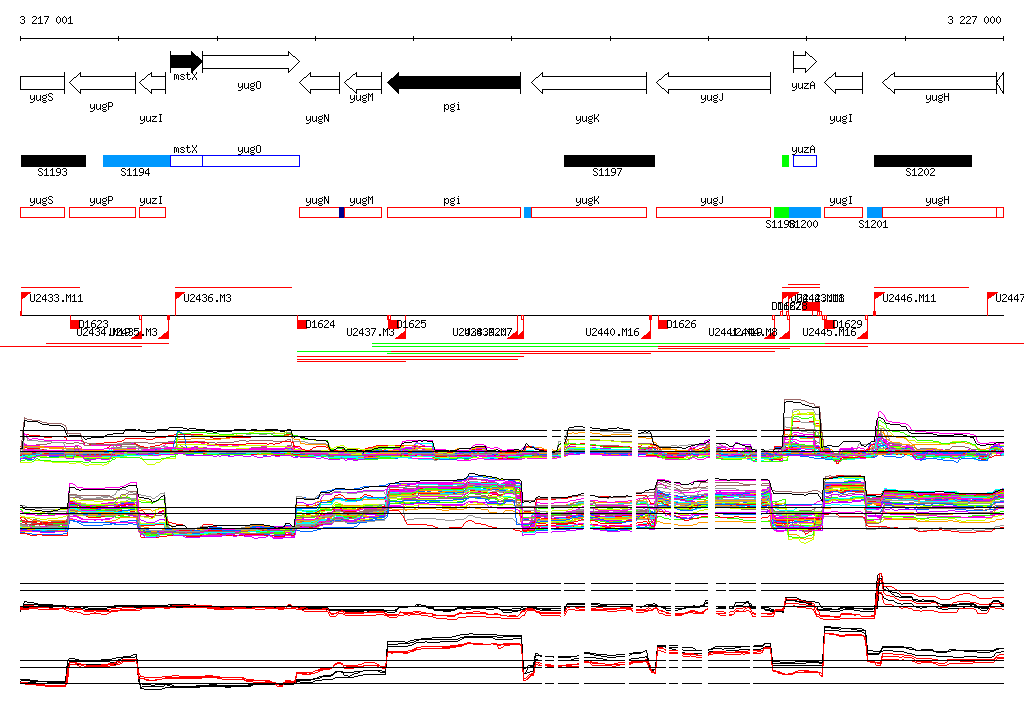
Genomic View of Gene/Segment S1197
Show/Hide
(Legend)
Browse Genome Context