B. subtilis Expression Data Browser
Start Page
B. subtilis Expression Data Browser
Gene/Segment:
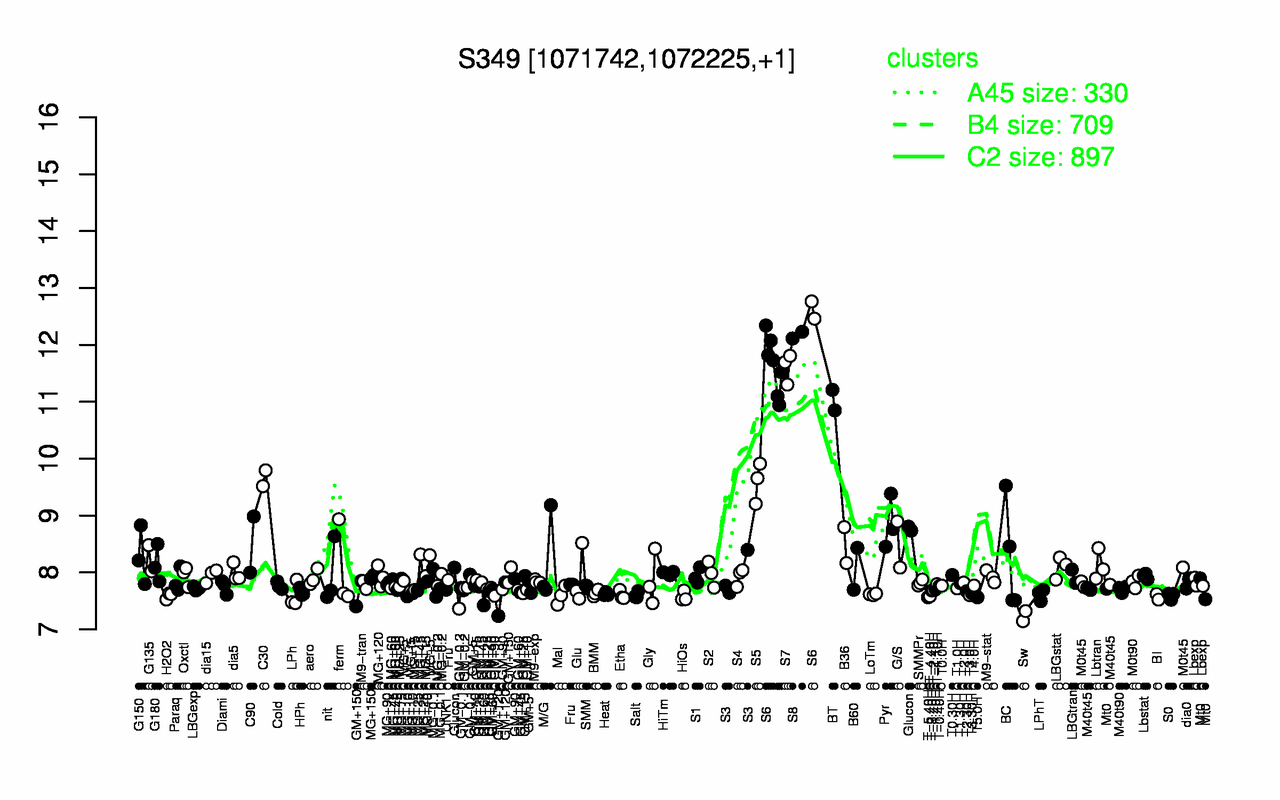
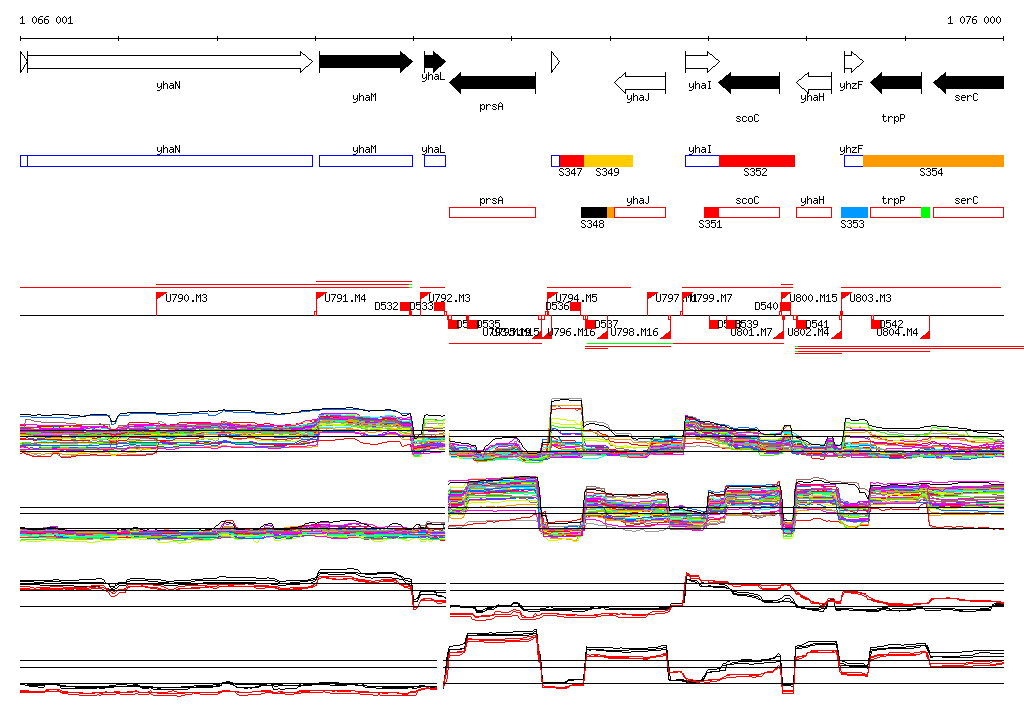
S349
Locus Tag:
new_1071742_1072225
Details about S349
Show/Hide
Highest Expression Conditions
S8
S6
S7
BT
C30
S5
Pyr
Glucon
G/S
C90
12.2
11.9
11.6
11
9.66
9.59
8.87
8.54
8.49
8.49
Lowest Expression Conditions
Sw
GM+120
T-5.40H
T5.0H
BI
HiOs
T-4.40H
S0
H2O2
Mal
7.23
7.53
7.56
7.56
7.57
7.58
7.58
7.59
7.59
7.6
Most Positively Correlated Segments
S1188
S632
S982
S1082
S1083
S1191
S447
S666
S379
S81
0.96
0.95
0.95
0.95
0.95
0.95
0.95
0.94
0.94
0.94
Most Negatively Correlated Segments
ptkA
yusH
parA
S1189
ykuH
bceR
S511
S1355
bceS
S1439
-0.8
-0.79
-0.79
-0.79
-0.78
-0.78
-0.78
-0.78
-0.76
-0.76
Expression Profile of Segment S349
Show/Hide
Genomic View of Gene/Segment S349
Show/Hide
(Legend)
Browse Genome Context