| Start Page |
|
 |
| Start Page |
|
|
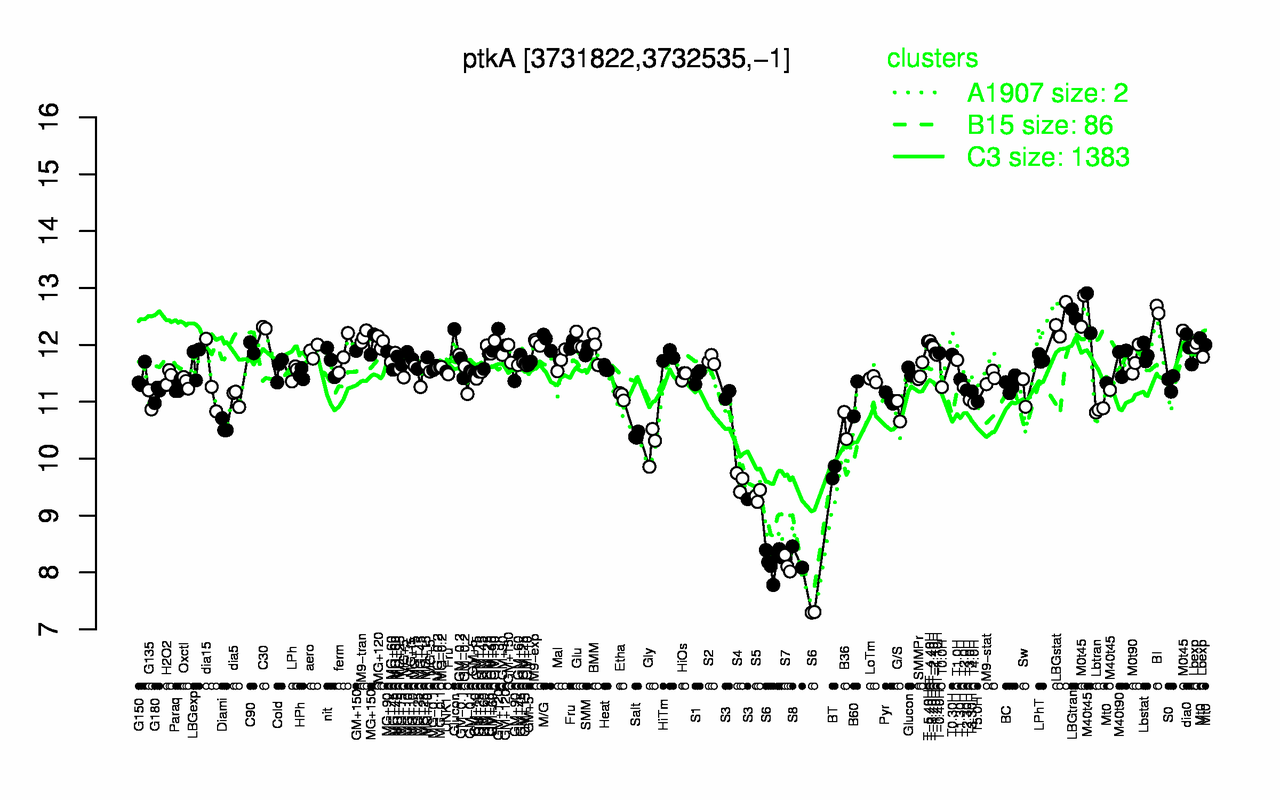
| BI | LBGtran | M0t45 | LBGstat | C30 | M9-tran | GM+120 | M40t45 | T-4.40H | M/G |
| 12.6 | 12.5 | 12.5 | 12.4 | 12.3 | 12.1 | 12.1 | 12.1 | 12.1 | 12.1 |
| S6 | S7 | S8 | S5 | S4 | BT | Gly | Salt | S3 | Diami |
| 8.01 | 8.14 | 8.27 | 9.35 | 9.6 | 9.76 | 10.2 | 10.4 | 10.5 | 10.6 |