B. subtilis Expression Data Browser
Start Page
B. subtilis Expression Data Browser
Gene/Segment:
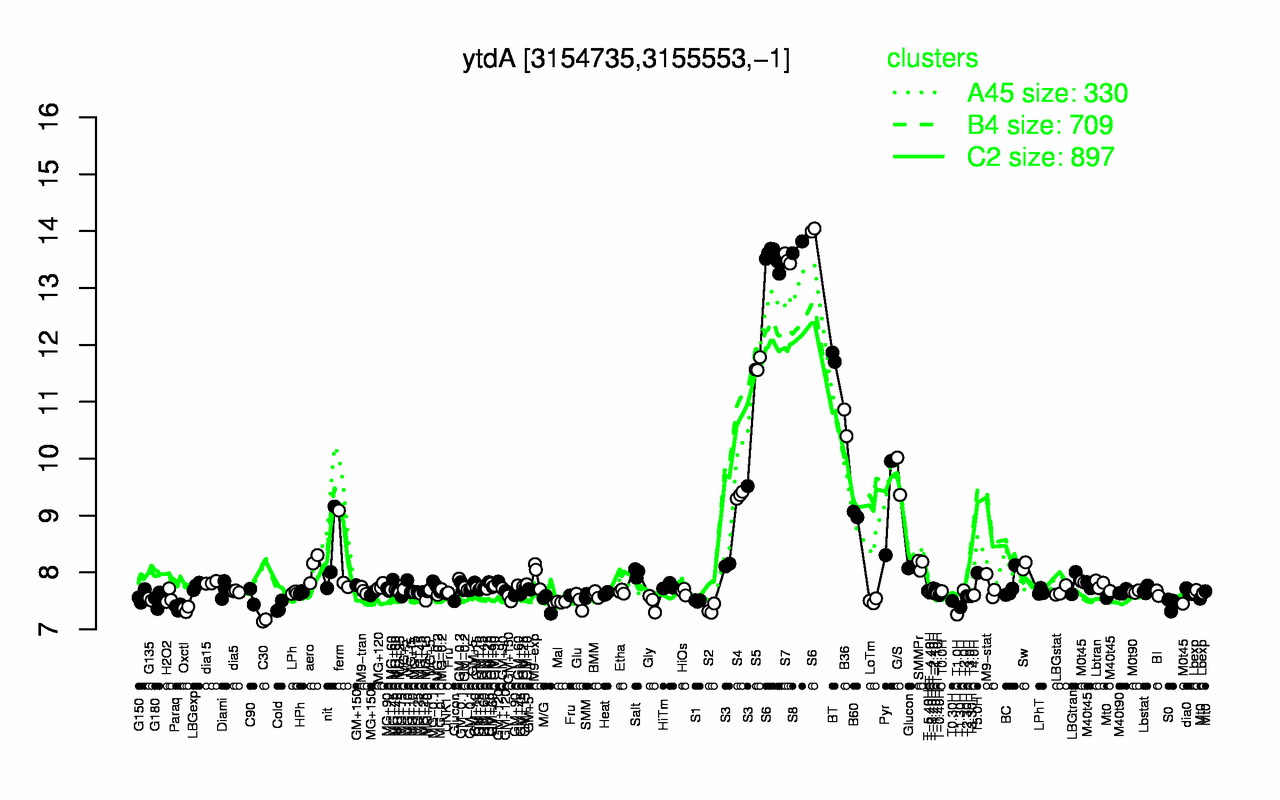
ytdA
Locus Tag:
BSU30850
Details about ytdA
Show/Hide
Highest Expression Conditions
S8
S6
S7
BT
S5
B36
G/S
Pyr
S4
B60
13.7
13.6
13.5
11.8
11.6
10.6
9.69
9.41
9.36
9.02
Lowest Expression Conditions
C30
T1.0H
S2
Oxctl
T1.30H
Cold
Paraq
S0
Gly
M/G
7.16
7.26
7.35
7.36
7.39
7.39
7.39
7.45
7.47
7.47
Most Positively Correlated Segments
fadM
ywrJ
yngK
S751
S698
cotH
S195
yheF
cotP
yndL
0.98
0.98
0.98
0.98
0.98
0.98
0.98
0.98
0.97
0.97
Most Negatively Correlated Segments
S1355
ptkA
parA
ykuH
S511
ylbG
bceR
S1189
yeaC
pbpD
-0.87
-0.87
-0.87
-0.87
-0.86
-0.85
-0.85
-0.85
-0.85
-0.85
Expression Profile of Segment ytdA
Show/Hide
Annotation of Gene ytdA
Show/Hide
function
16.14: Store
function
16.8: Protect
inference
ab initio prediction:AMIGene:2.0
codon_start
1
EC_number
2.7.7.9
transl_table
11
note
Evidence 3: Function proposed based on presence of conserved amino acid motif, structural feature or limited homology; Product type pe: putative enzyme
db_xref
GI:2635569
product
putative UTP-glucose-1-phosphate uridylyltransferase
protein_id
CAB15063.1
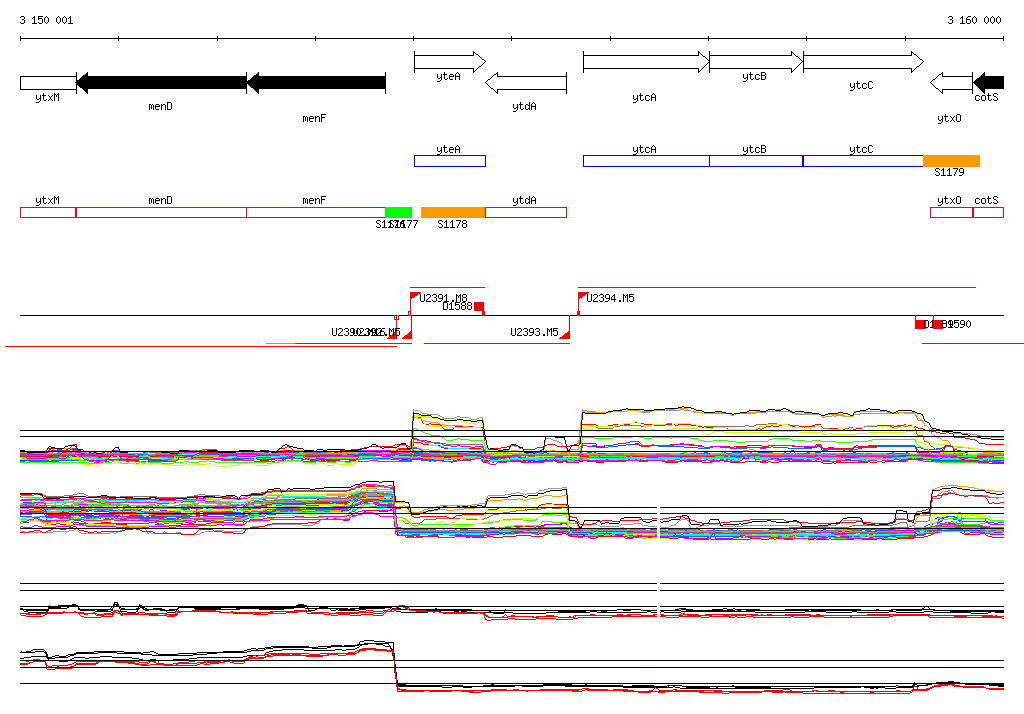
Genomic View of Gene/Segment ytdA
Show/Hide
(Legend)
Browse Genome Context