B. subtilis Expression Data Browser
Start Page
B. subtilis Expression Data Browser
Gene/Segment:
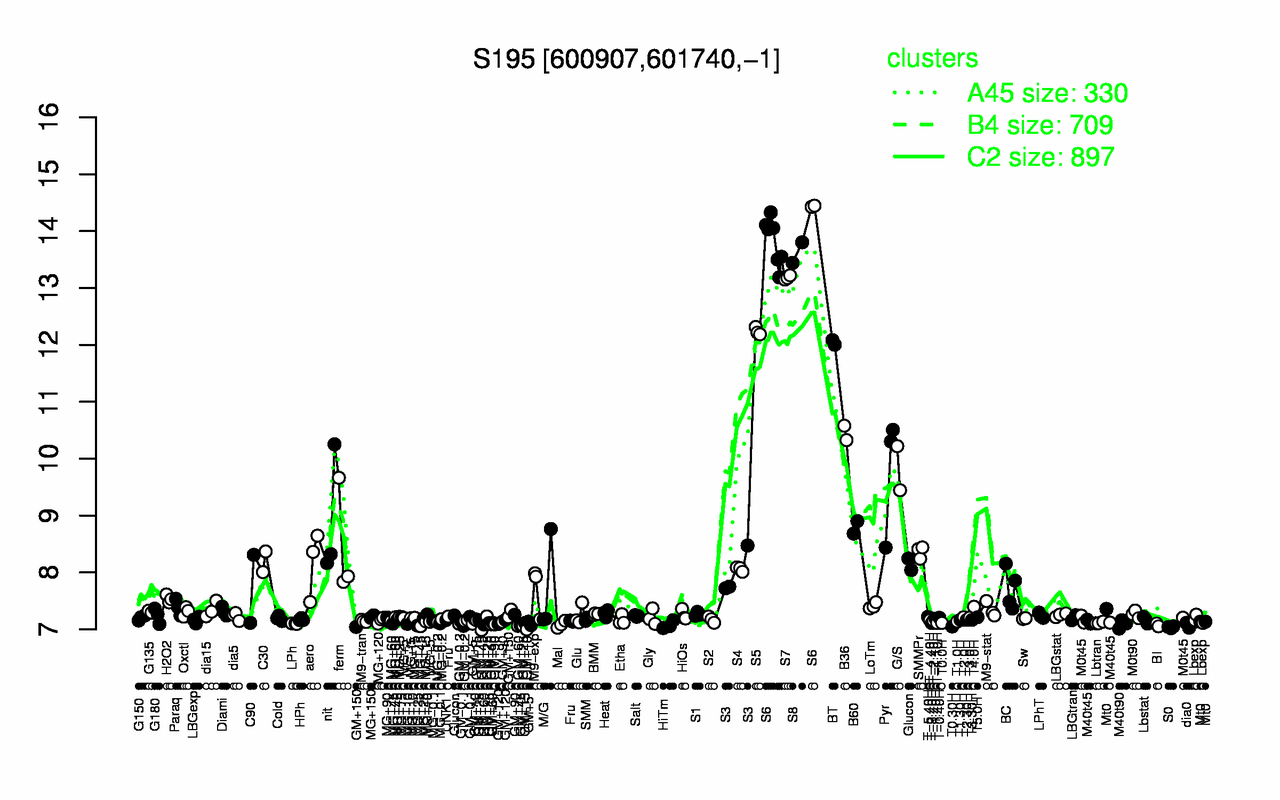
S195
Locus Tag:
new_600907_601740_c
Details about S195
Show/Hide
Highest Expression Conditions
S6
S8
S7
S5
BT
B36
G/S
Pyr
nit
B60
14
13.6
13.2
12.2
12
10.5
9.83
9.75
8.91
8.79
Lowest Expression Conditions
S0
GM+45
T0.30H
BI
HiTm
dia0
GM+60
GM+10
Mal
M40t90
7.04
7.05
7.05
7.08
7.08
7.08
7.09
7.09
7.09
7.09
Most Positively Correlated Segments
cotP
ydgB
ydgA
ypqA
yoaN
S842
S872
S841
yitD
yitB
1
0.99
0.99
0.99
0.99
0.99
0.99
0.98
0.98
0.98
Most Negatively Correlated Segments
parA
ykuH
S1355
bceR
ptkA
S511
bceS
S1189
yeaC
pbpD
-0.85
-0.85
-0.84
-0.84
-0.84
-0.83
-0.83
-0.83
-0.83
-0.82
Expression Profile of Segment S195
Show/Hide
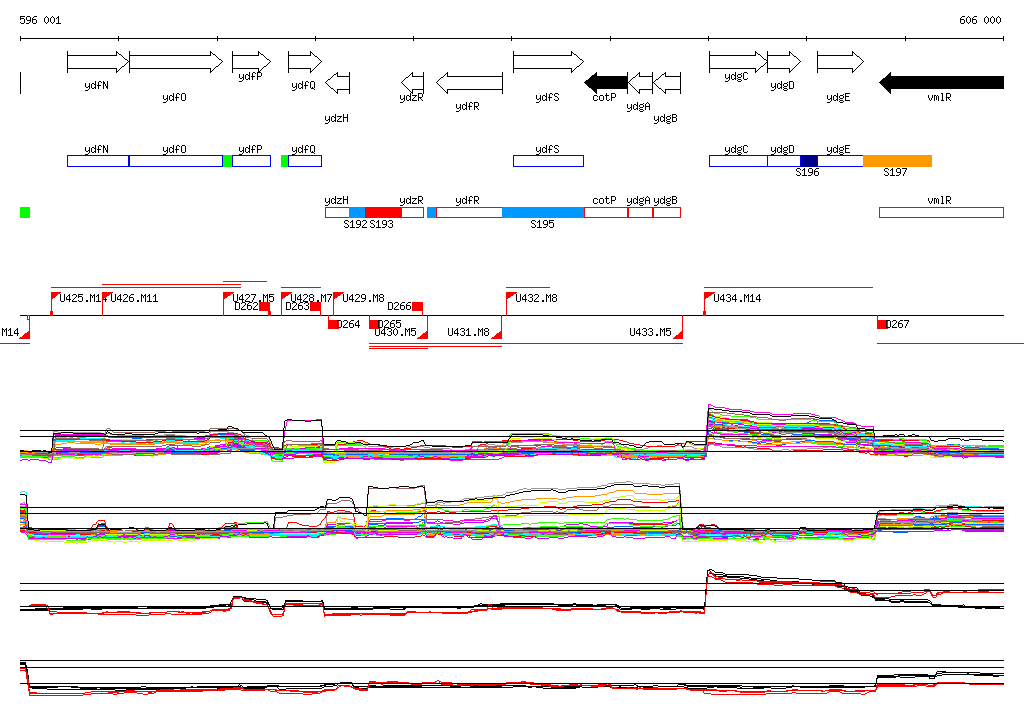
Genomic View of Gene/Segment S195
Show/Hide
(Legend)
Browse Genome Context