B. subtilis Expression Data Browser
Start Page
B. subtilis Expression Data Browser
Gene/Segment:
bceS
Locus Tag:
BSU30390
Details about bceS
Show/Hide
Highest Expression Conditions
Sw
Cold
C90
LBGtran
BI
dia5
M40t45
BC
Lbtran
M0t90
11.7
11.3
11.2
11.2
11.1
11.1
11
11
11
11
Lowest Expression Conditions
S8
S7
S6
S5
S4
BT
S3
G/S
Pyr
nit
7.55
7.65
7.93
8.3
8.67
9.27
9.32
9.34
9.62
9.83
Most Positively Correlated Segments
bceR
yfmR
yvfU
kinD
moaE
mobB
polX
pbpD
moeA
yvfT
0.97
0.91
0.89
0.88
0.88
0.87
0.87
0.87
0.86
0.86
Most Negatively Correlated Segments
yppG
yhjR
yrrI
yozP
yqhR
ykoP
ydfR
cotH
S1177
S1386
-0.89
-0.89
-0.87
-0.87
-0.87
-0.87
-0.86
-0.86
-0.86
-0.86
Expression Profile of Segment bceS
Show/Hide
Annotation of Gene bceS
Show/Hide
function
16.12: Sense
function
16.3: Control
inference
ab initio prediction:AMIGene:2.0
codon_start
1
product
two-component sensor histidine kinase controlling resistance to antibiotics affecting the envelope [YtsA]
transl_table
11
note
Evidence 1a: Function experimentally demonstrated in the studied strain; PubMedId: 11717295, 17905982; Product type rc: receptor
db_xref
GI:2635523
protein_id
CAB15017.1
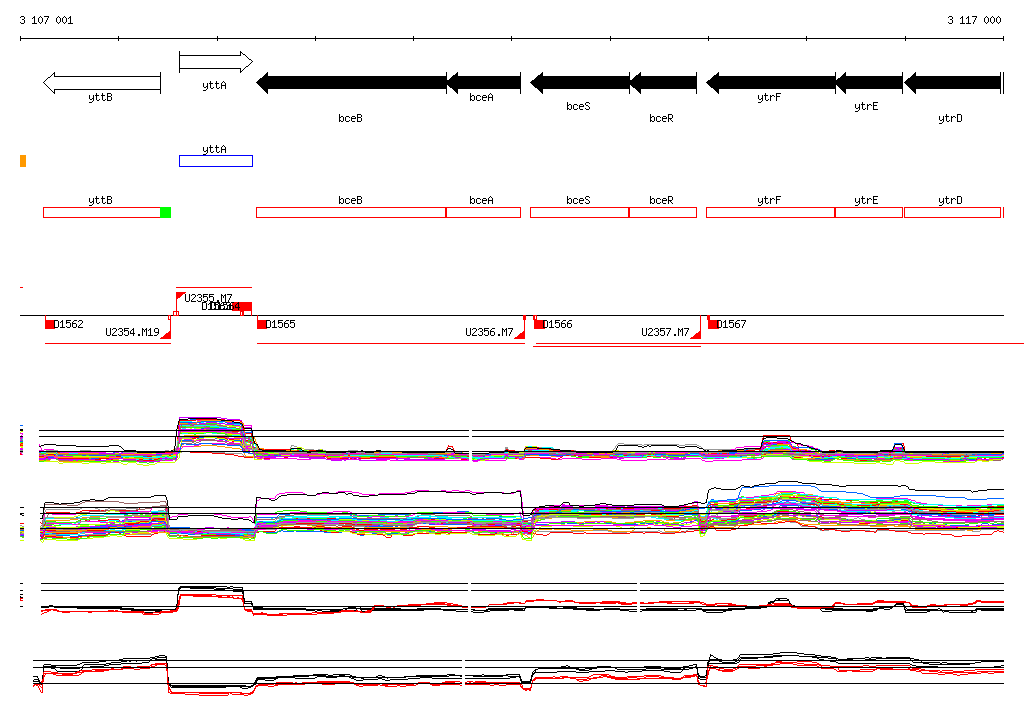
Genomic View of Gene/Segment bceS
Show/Hide
(Legend)
Browse Genome Context