B. subtilis Expression Data Browser
Start Page
B. subtilis Expression Data Browser
Gene/Segment:
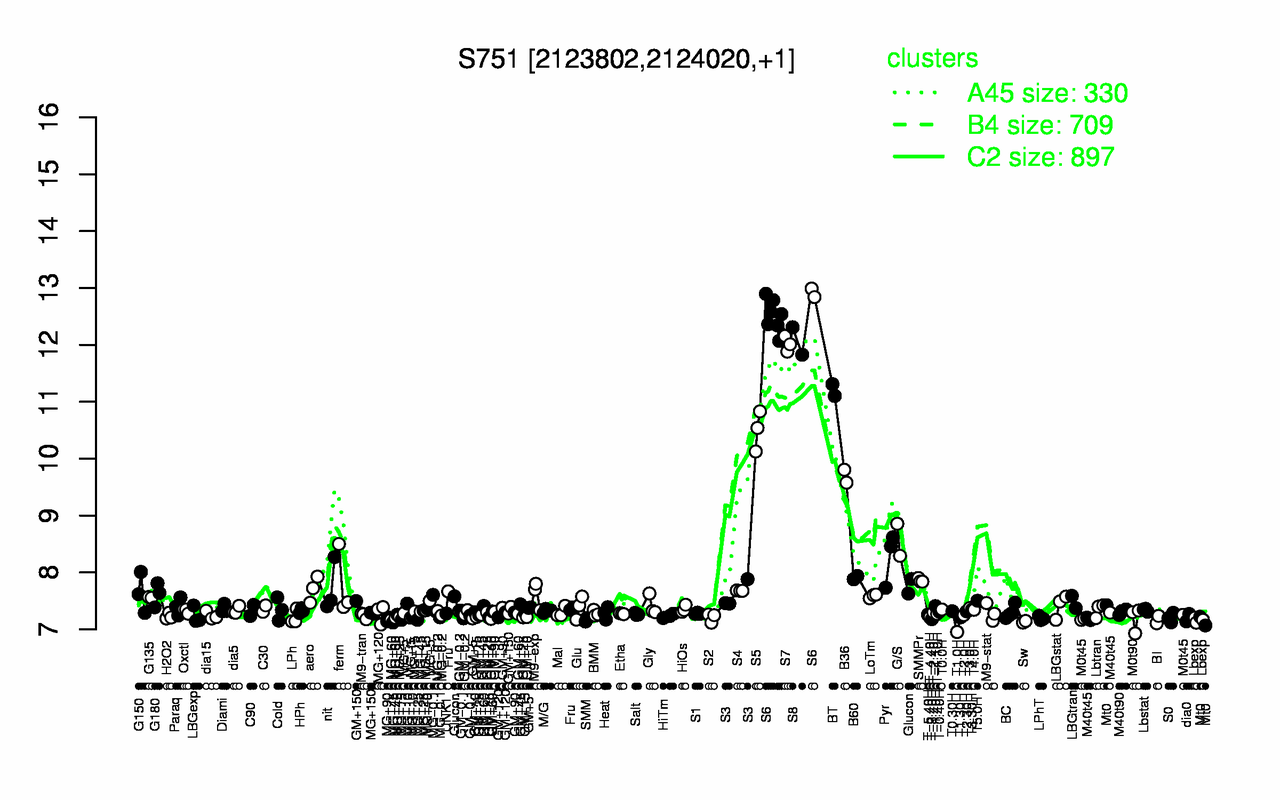
S751
Locus Tag:
new_2123802_2124020
Details about S751
Show/Hide
Highest Expression Conditions
S6
S8
S7
BT
S5
B36
G/S
Pyr
B60
SMMPr
12.6
12.1
12
11.2
10.5
9.69
8.57
8.27
7.91
7.86
Lowest Expression Conditions
T1.0H
Sw
Lbexp
BI
MG+90
SMM
T-3.40H
MG+60
M0t90
LPhT
6.95
7.13
7.16
7.17
7.17
7.18
7.18
7.19
7.19
7.2
Most Positively Correlated Segments
yngK
S698
S81
ytdA
fadM
yheF
S195
ypqA
S842
ylbE
0.98
0.98
0.98
0.98
0.98
0.98
0.98
0.97
0.97
0.97
Most Negatively Correlated Segments
ptkA
parA
ykuH
S1189
S1355
S511
bceR
bceS
ylbG
pbpD
-0.86
-0.85
-0.85
-0.85
-0.84
-0.84
-0.83
-0.83
-0.82
-0.82
Expression Profile of Segment S751
Show/Hide
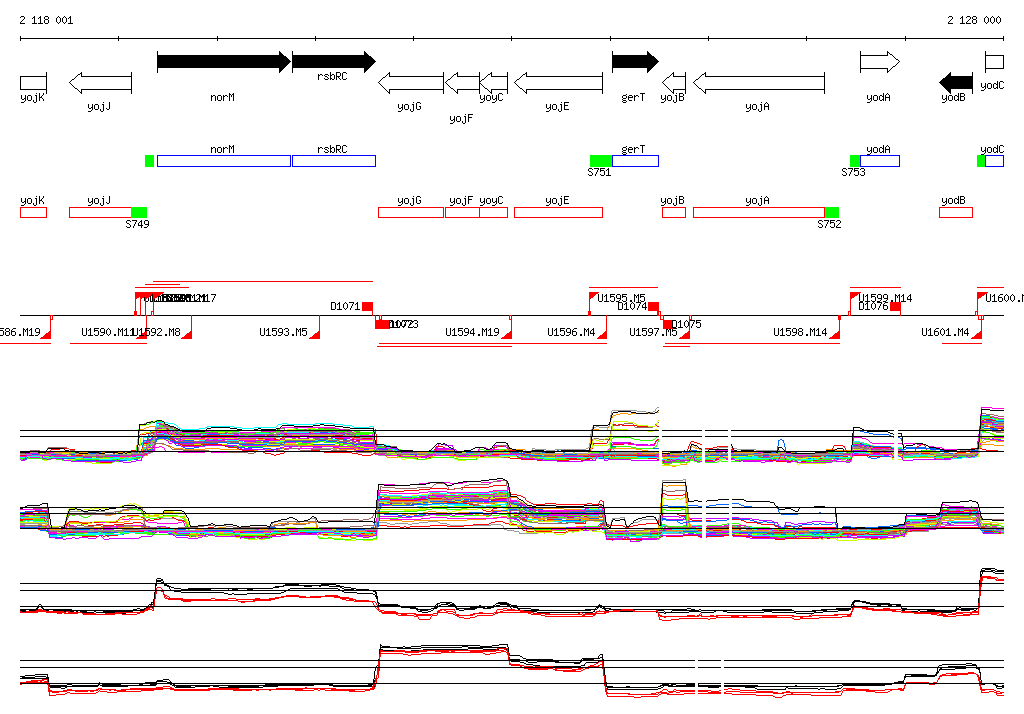
Genomic View of Gene/Segment S751
Show/Hide
(Legend)
Browse Genome Context