B. subtilis Expression Data Browser
Start Page
B. subtilis Expression Data Browser
Gene/Segment:
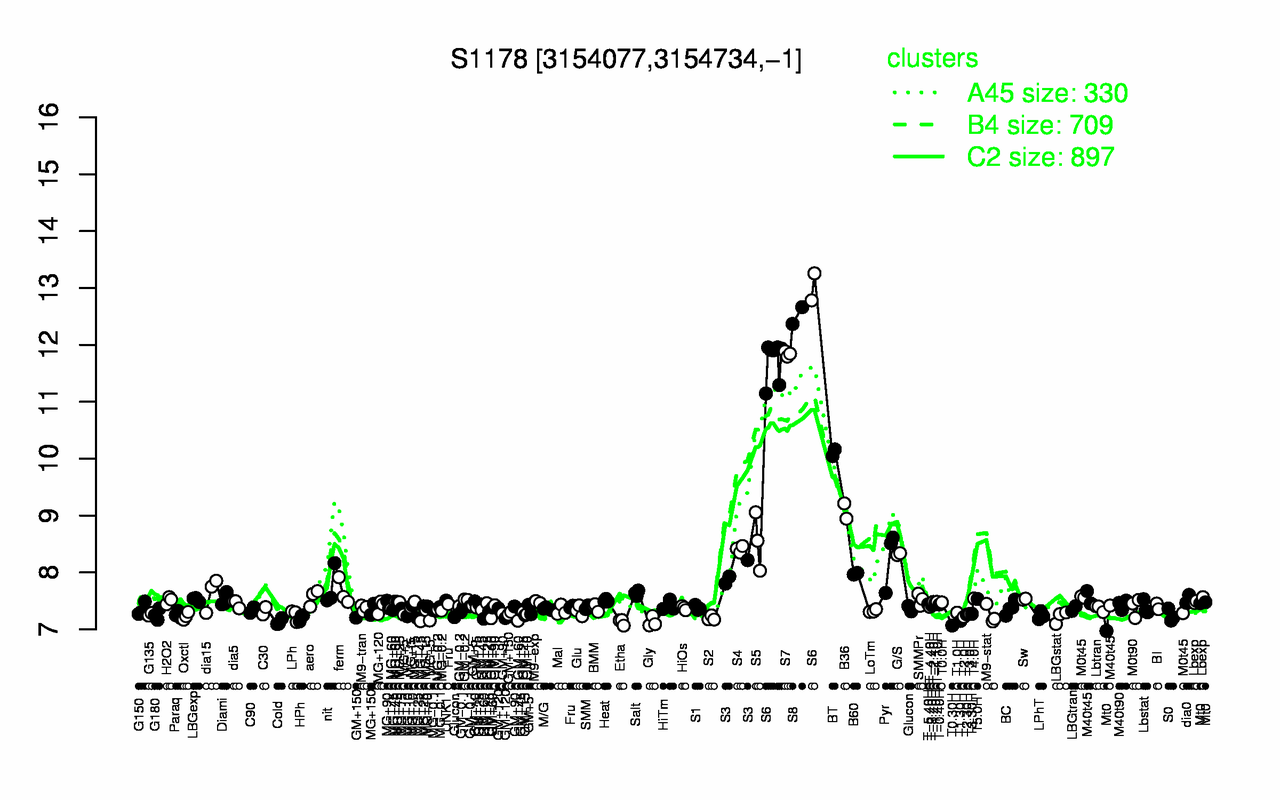
S1178
Locus Tag:
new_3154077_3154734_c
Details about S1178
Show/Hide
Highest Expression Conditions
S8
S6
S7
BT
B36
S5
S4
G/S
Pyr
S3
12.5
12
11.8
10.1
9.08
8.55
8.41
8.32
8.25
7.98
Lowest Expression Conditions
T0.30H
Etha
Cold
Gly
T1.30H
S2
MG+5
HPh
T2.0H
LBGstat
7.07
7.13
7.13
7.13
7.15
7.2
7.21
7.21
7.22
7.22
Most Positively Correlated Segments
yheF
S1264
ytdA
S422
fadM
S1177
S751
S1191
S1083
S698
0.97
0.97
0.97
0.97
0.96
0.96
0.96
0.95
0.95
0.95
Most Negatively Correlated Segments
parA
ptkA
S1355
ykuH
parB
S511
S1439
bceS
bceR
S1189
-0.87
-0.85
-0.85
-0.84
-0.83
-0.83
-0.83
-0.82
-0.82
-0.82
Expression Profile of Segment S1178
Show/Hide
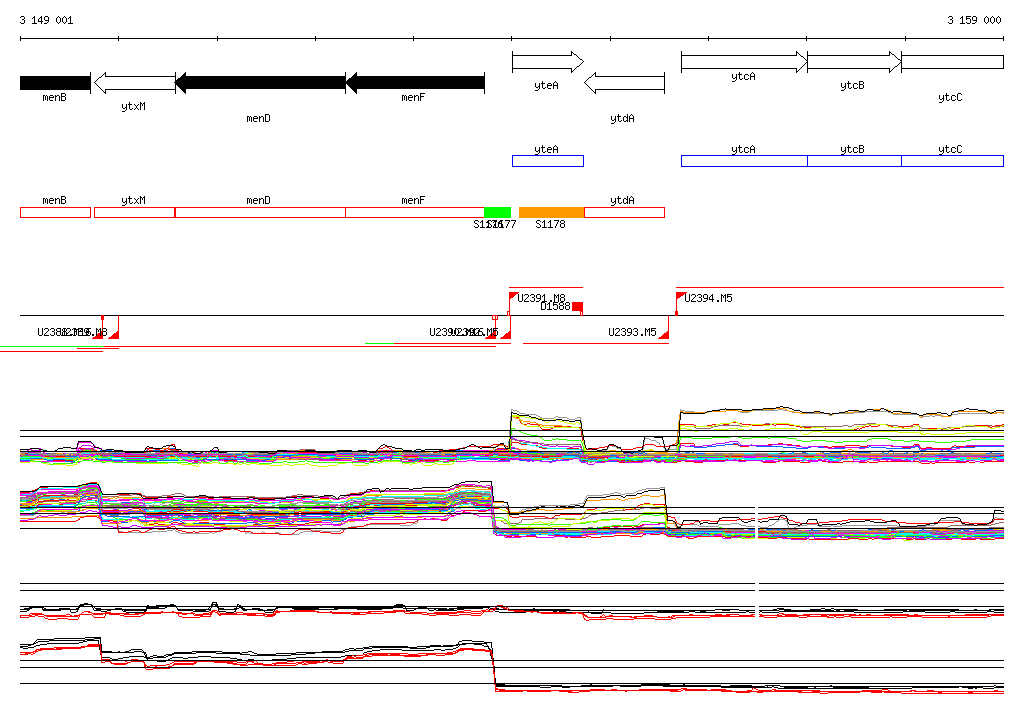
Genomic View of Gene/Segment S1178
Show/Hide
(Legend)
Browse Genome Context