B. subtilis Expression Data Browser
Details about S47 Show/Hide
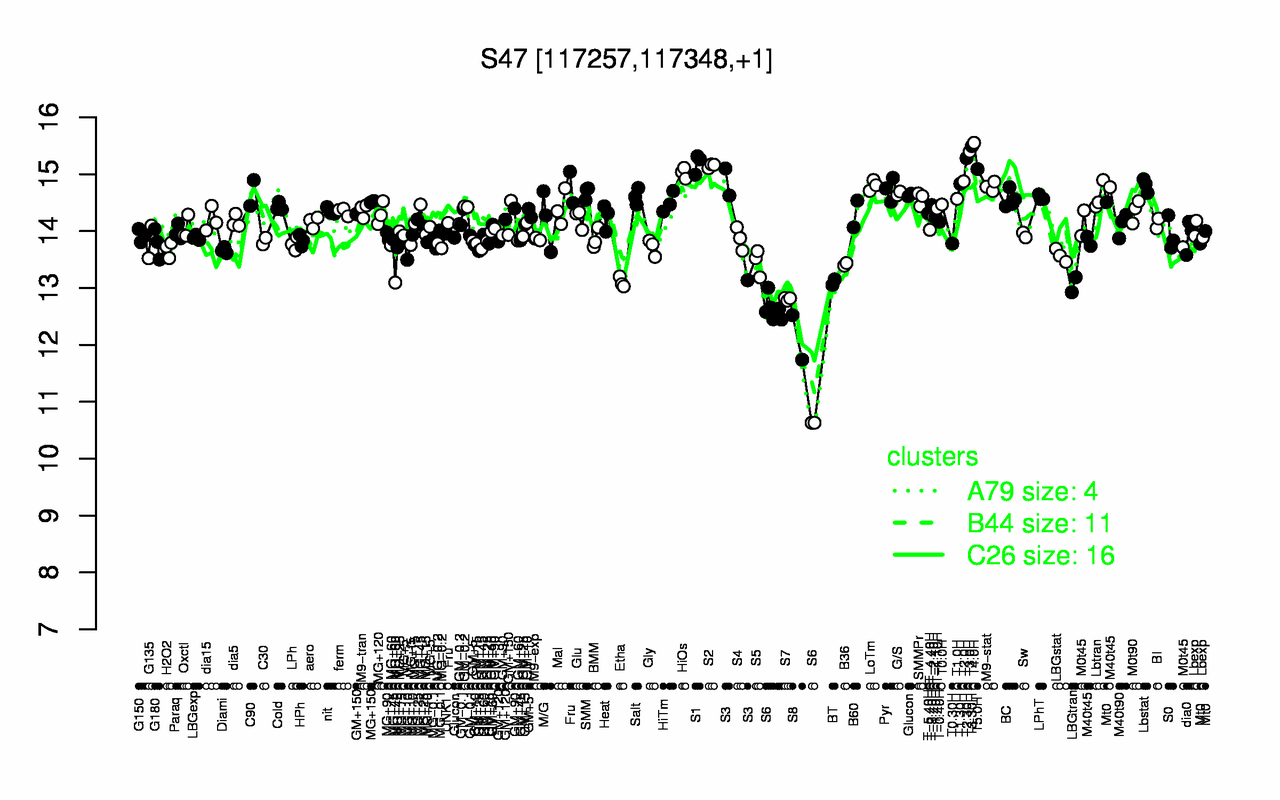
Highest Expression Conditions
T4.0H T3.30H T3.0H T2.30H S1 S2 T5.0H HiOs T2.0H T1.30H
15.6 15.5 15.4 15.3 15.2 15.1 15.1 15 14.9 14.8
Lowest Expression Conditions
S8 S6 S7 LBGtran Etha BT B36 MG+60 S5 LBGstat
12.1 12.2 12.8 13.1 13.1 13.1 13.4 13.4 13.5 13.6
Most Positively Correlated Segments
sigH rpmGB secE yobK ftsA yfmI S560 S1564 ynaF S607
0.9 0.89 0.84 0.77 0.77 0.76 0.76 0.75 0.73 0.73
Most Negatively Correlated Segments
S1433 ywbA ytwI S1280 S1432 yvnB ykzH S1197 S425 yhcT
-0.75 -0.74 -0.73 -0.73 -0.73 -0.72 -0.72 -0.72 -0.71 -0.7
Expression Profile of Segment S47 Show/Hide
Genomic View of Gene/Segment S47 Show/Hide
(Legend)