| Start Page |
|
 |
| Start Page |
|
|
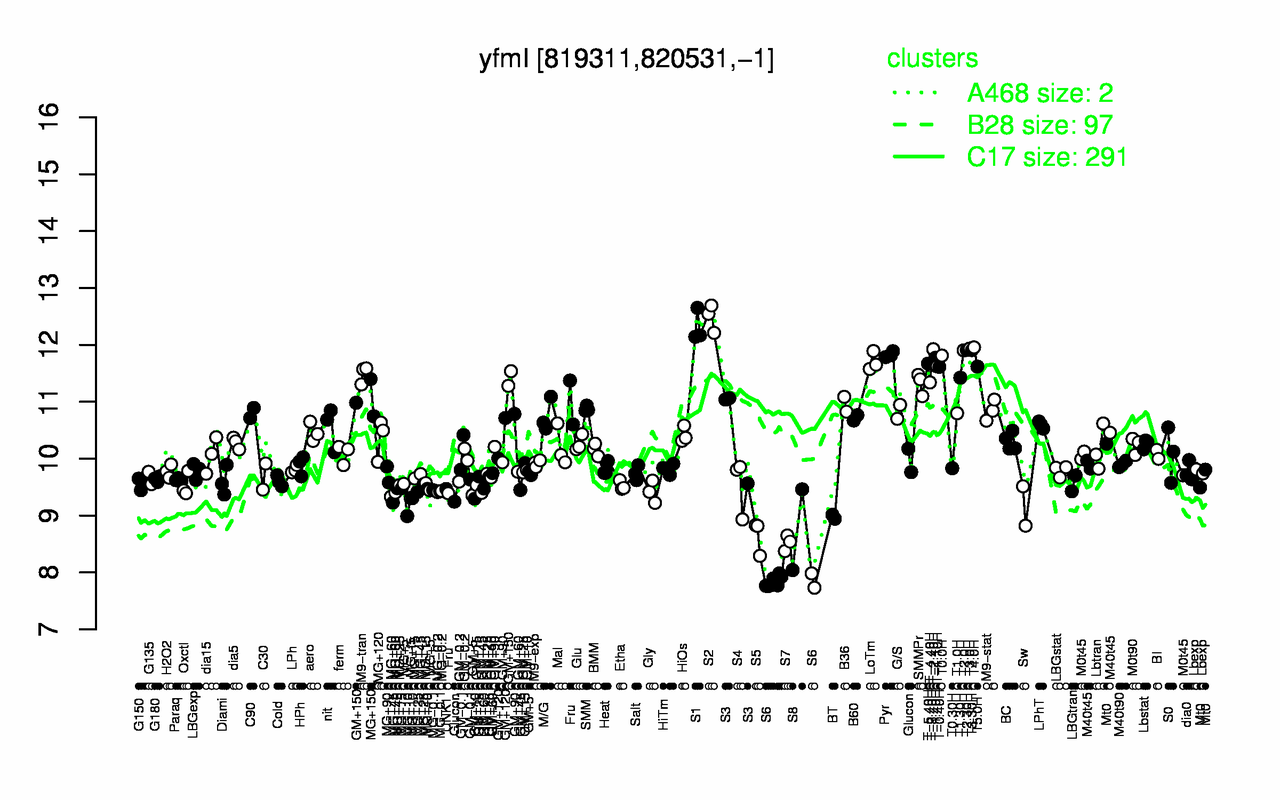
| S2 | S1 | T4.0H | T3.0H | T-2.40H | T2.30H | T3.30H | T2.0H | Pyr | T0.0H |
| 12.5 | 12.3 | 12 | 11.9 | 11.9 | 11.9 | 11.9 | 11.9 | 11.8 | 11.8 |
| S6 | S7 | S5 | S8 | BT | Sw | MG+10 | MG+t5 | MG+60 | Gly |
| 7.84 | 8.52 | 8.65 | 8.75 | 8.98 | 9.17 | 9.26 | 9.31 | 9.37 | 9.42 |