| Start Page |
|
 |
| Start Page |
|
|
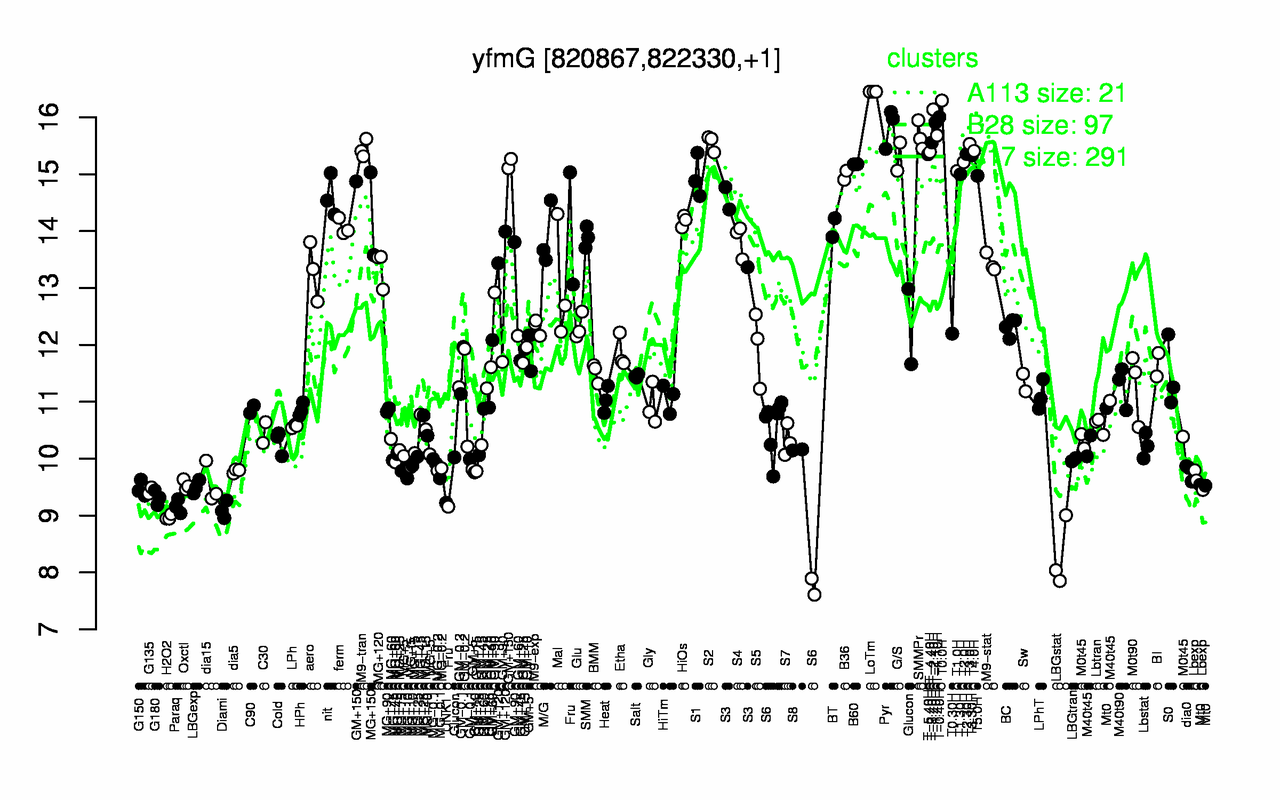
| LoTm | T0.0H | T-2.40H | T-0.40H | T-1.40H | Pyr | T-1.10H | SMMPr | T-3.40H | S2 |
| 16.5 | 16.3 | 16.1 | 16 | 15.9 | 15.8 | 15.7 | 15.7 | 15.6 | 15.6 |
| LBGstat | H2O2 | Diami | Paraq | UNK1 | G180 | G135 | G150 | LBGexp | Oxctl |
| 8.3 | 8.97 | 9.1 | 9.16 | 9.22 | 9.31 | 9.44 | 9.47 | 9.5 | 9.54 |