| Start Page |
|
 |
| Start Page |
|
|
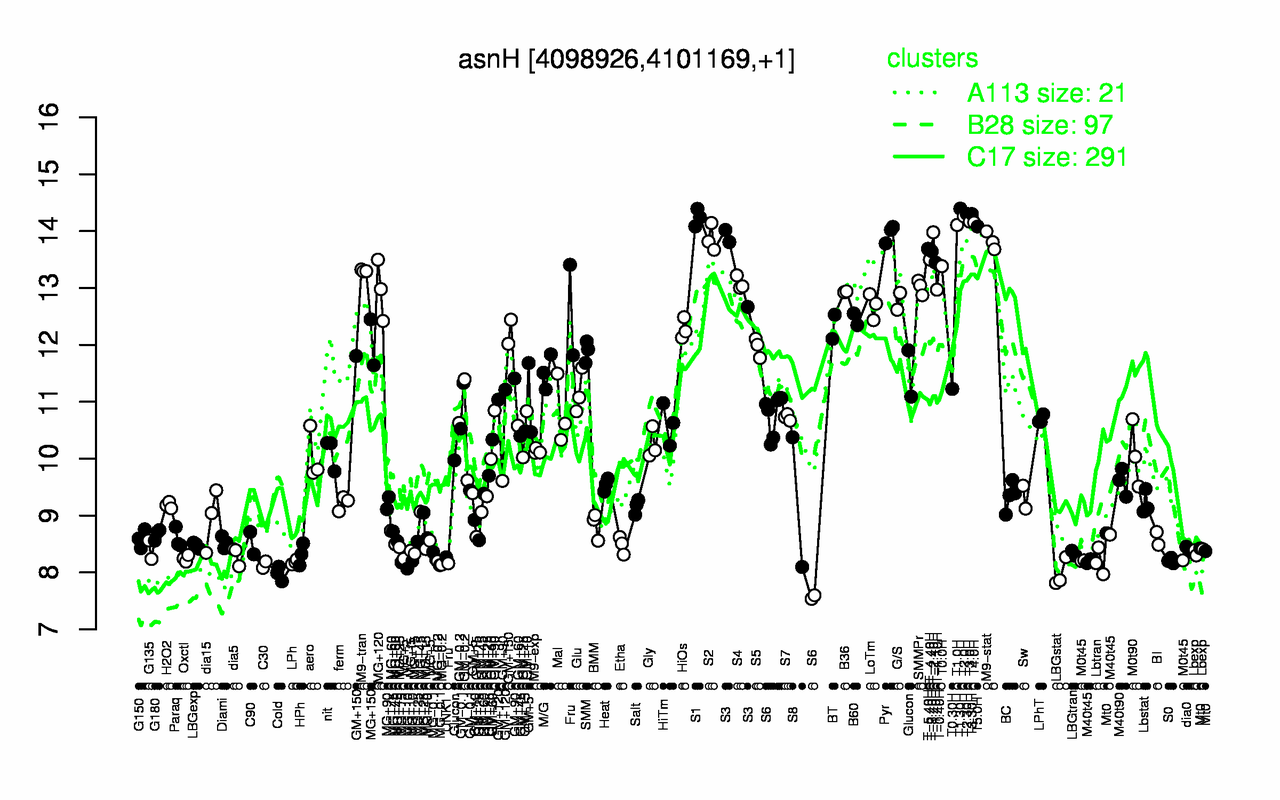
| T1.30H | T2.30H | T3.30H | T2.0H | S1 | T3.0H | T4.0H | T1.0H | T5.0H | T-2.40H |
| 14.4 | 14.3 | 14.3 | 14.3 | 14.2 | 14.2 | 14.2 | 14.1 | 14.1 | 14 |
| Cold | LBGstat | C30 | MG-0.2 | LPh | Lbtran | S0 | M0t45 | MG-0.1 | Oxctl |
| 7.98 | 7.98 | 8.14 | 8.17 | 8.18 | 8.19 | 8.21 | 8.21 | 8.24 | 8.25 |