| Start Page |
|
 |
| Start Page |
|
|
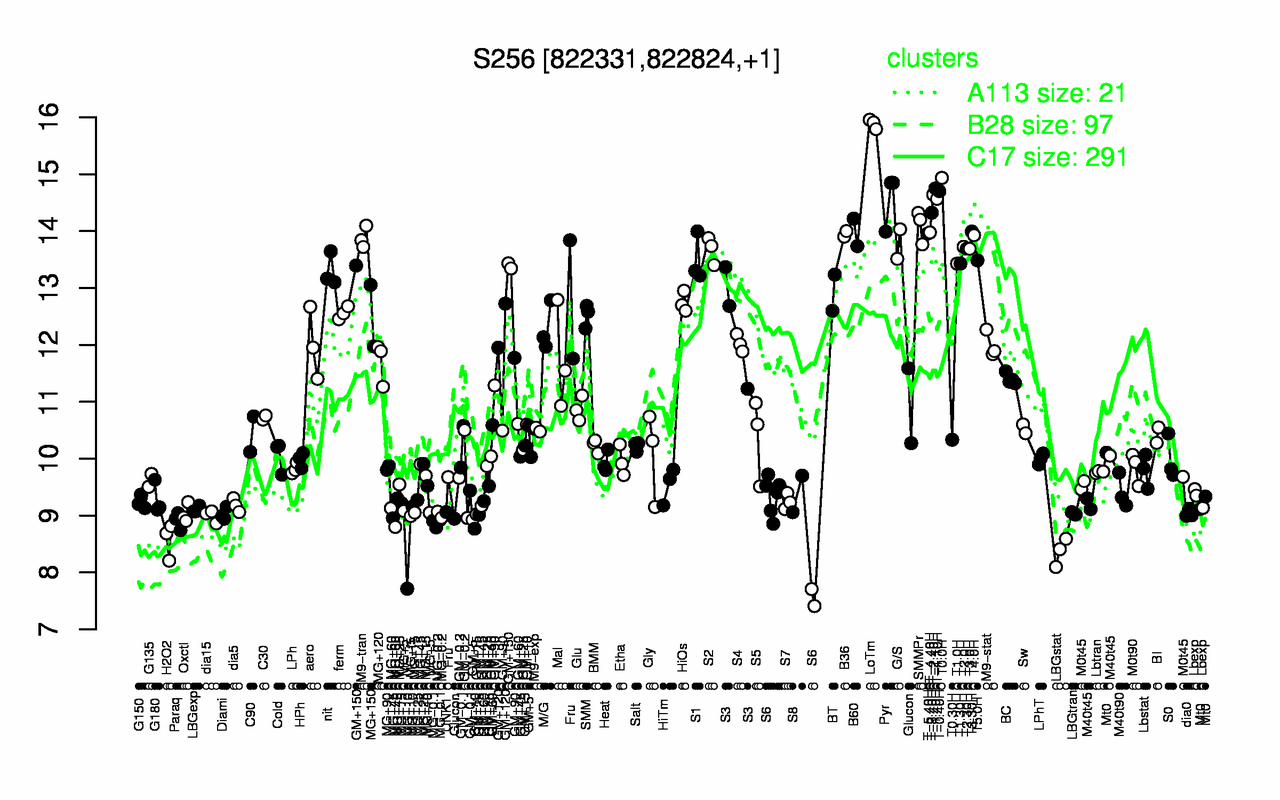
| LoTm | T0.0H | T-1.40H | T-0.40H | T-2.40H | T-1.10H | Pyr | T-3.40H | SMMPr | T3.30H |
| 15.9 | 14.9 | 14.7 | 14.7 | 14.6 | 14.6 | 14.6 | 14.3 | 14.1 | 14 |
| LBGstat | H2O2 | MG+10 | MG-0.1 | Paraq | MG+60 | S6 | dia15 | MG+t5 | MG-0.2 |
| 8.37 | 8.57 | 8.8 | 8.88 | 8.91 | 8.96 | 8.97 | 8.99 | 8.99 | 9.01 |