| Start Page |
|
 |
| Start Page |
|
|
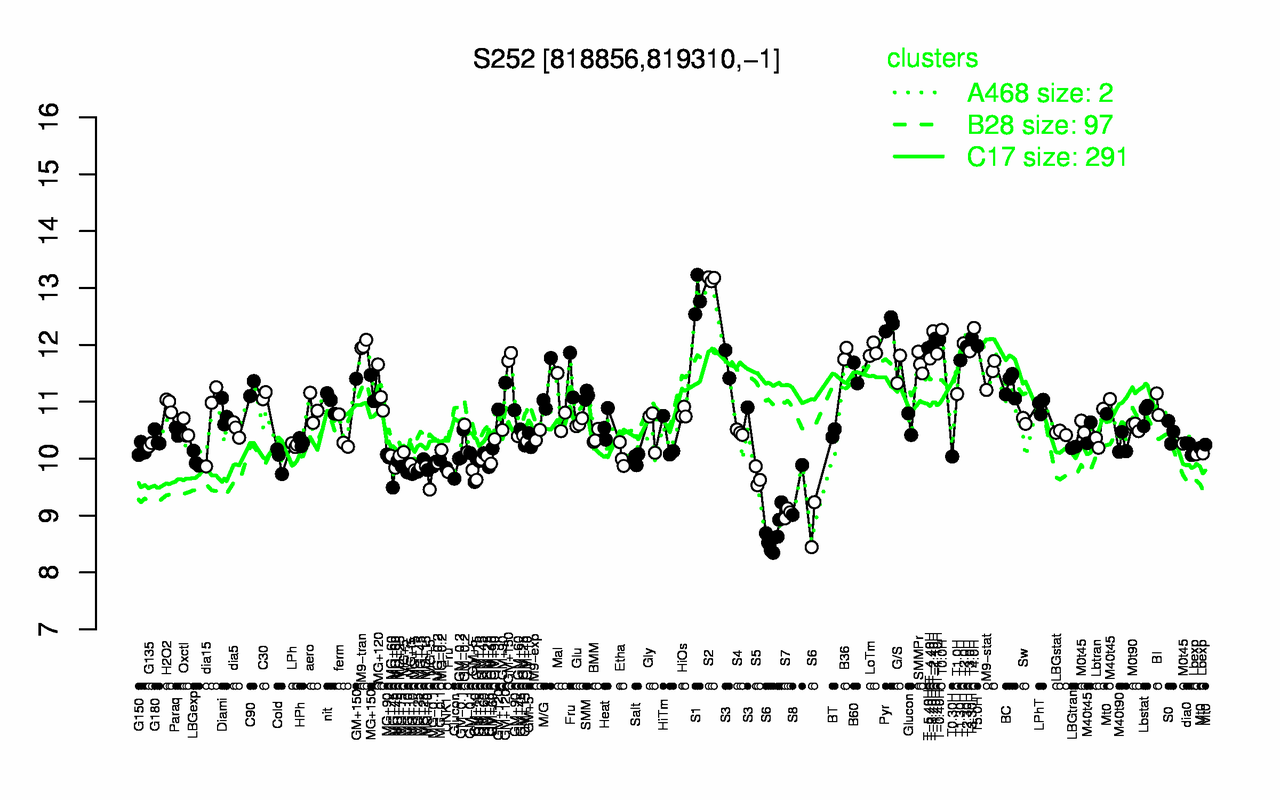
| S2 | S1 | Pyr | T4.0H | T0.0H | T-2.40H | T3.30H | T-1.40H | T-0.40H | T2.0H |
| 13.2 | 12.8 | 12.4 | 12.3 | 12.3 | 12.2 | 12.1 | 12.1 | 12.1 | 12 |
| S6 | S7 | S8 | S5 | MG+10 | MG+45 | MG+5 | UNK1 | MG+15 | GM+15 |
| 8.71 | 9.05 | 9.45 | 9.68 | 9.76 | 9.77 | 9.79 | 9.84 | 9.84 | 9.9 |