| Start Page |
|
 |
| Start Page |
|
|
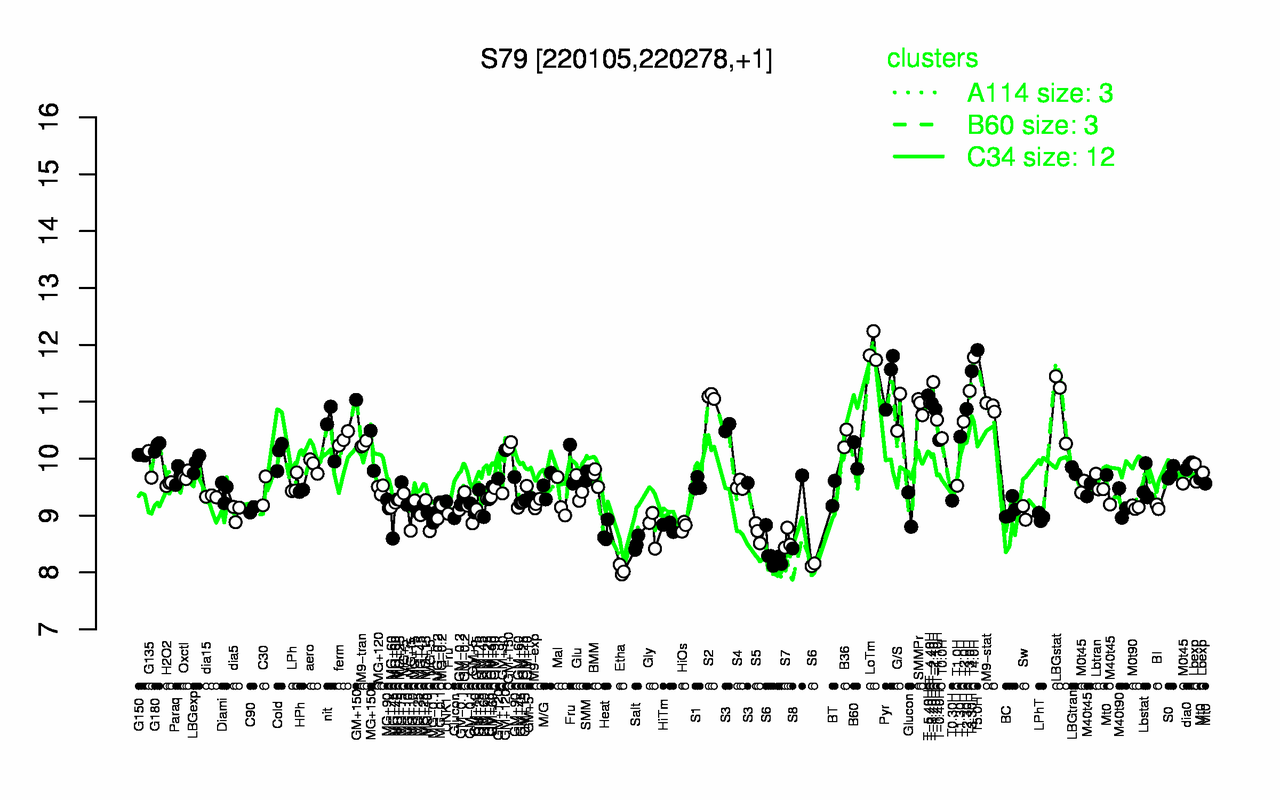
| LoTm | T5.0H | T4.0H | T3.30H | Pyr | T-2.40H | T3.0H | T-5.40H | S2 | LBGstat |
| 11.9 | 11.9 | 11.8 | 11.5 | 11.4 | 11.3 | 11.2 | 11.1 | 11.1 | 11 |
| Etha | S6 | Salt | S7 | S5 | Heat | MG+t5 | Gly | HiTm | HiOs |
| 8.04 | 8.28 | 8.51 | 8.57 | 8.7 | 8.71 | 8.73 | 8.78 | 8.81 | 8.81 |