| Start Page |
|
 |
| Start Page |
|
|
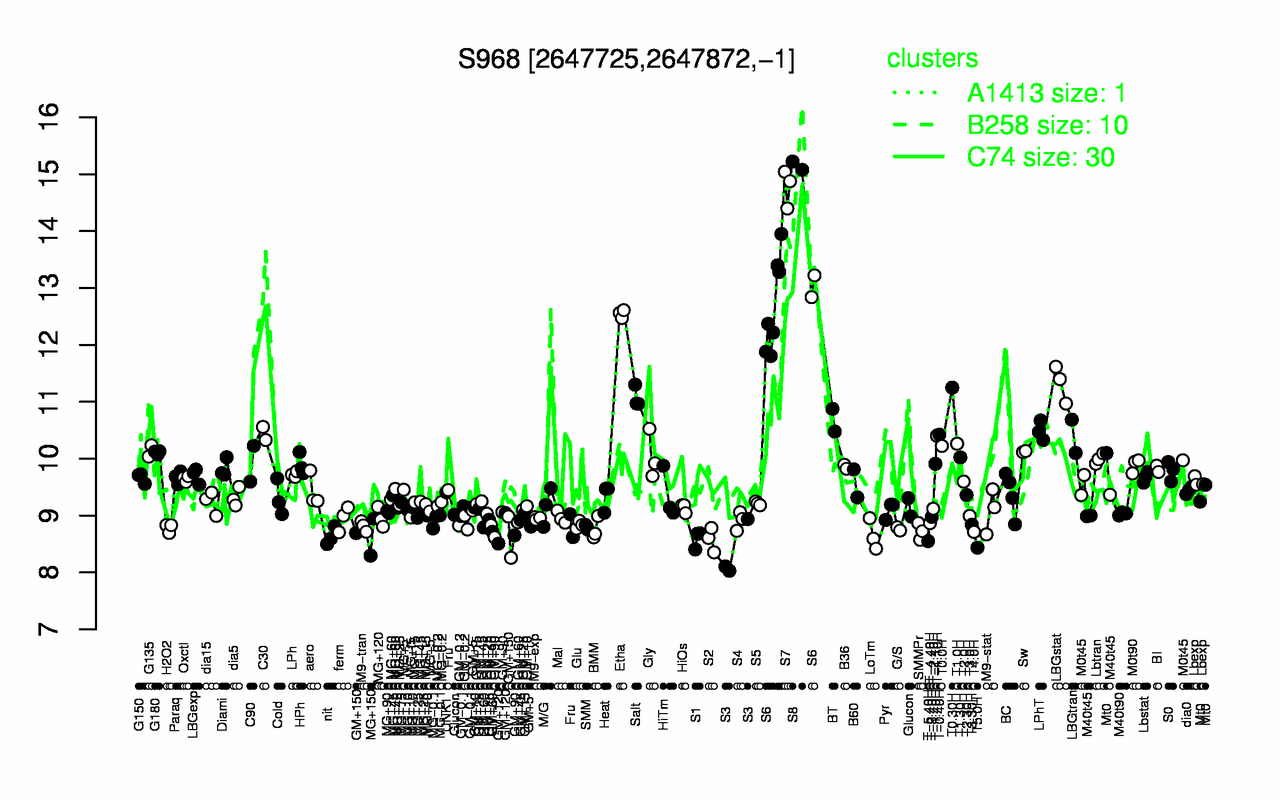
| S8 | S7 | S6 | Etha | LBGstat | T0.30H | Salt | BT | LPhT | C30 |
| 15.2 | 14.8 | 12.8 | 12.5 | 11.3 | 11.2 | 11.1 | 10.7 | 10.5 | 10.4 |
| S3 | T5.0H | T-5.40H | S2 | S1 | MG+150 | nit | GM+150 | LoTm | T4.0H |
| 8.36 | 8.44 | 8.55 | 8.58 | 8.59 | 8.62 | 8.64 | 8.64 | 8.66 | 8.71 |