| Start Page |
|
 |
| Start Page |
|
|
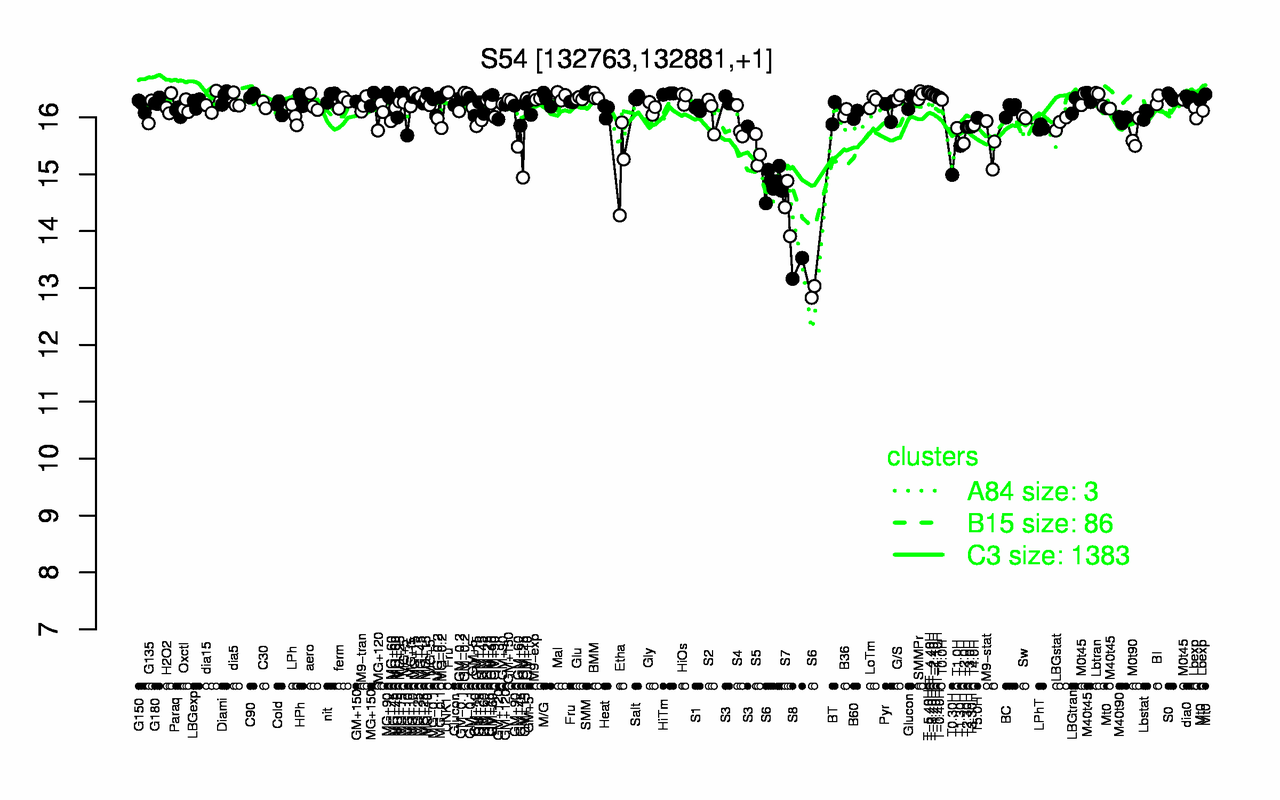
| T-5.40H | T-4.40H | UNK1 | SMM | HiTm | T-3.40H | T-2.40H | SMMPr | MG+90 | MG+15 |
| 16.4 | 16.4 | 16.4 | 16.4 | 16.4 | 16.4 | 16.4 | 16.4 | 16.4 | 16.4 |
| S8 | S7 | S6 | T0.30H | Etha | S5 | T1.30H | M9-stat | T2.0H | M0t90 |
| 13.3 | 14.4 | 14.4 | 15 | 15.1 | 15.4 | 15.5 | 15.5 | 15.5 | 15.7 |