B. subtilis Expression Data Browser
Start Page
B. subtilis Expression Data Browser
Gene/Segment:
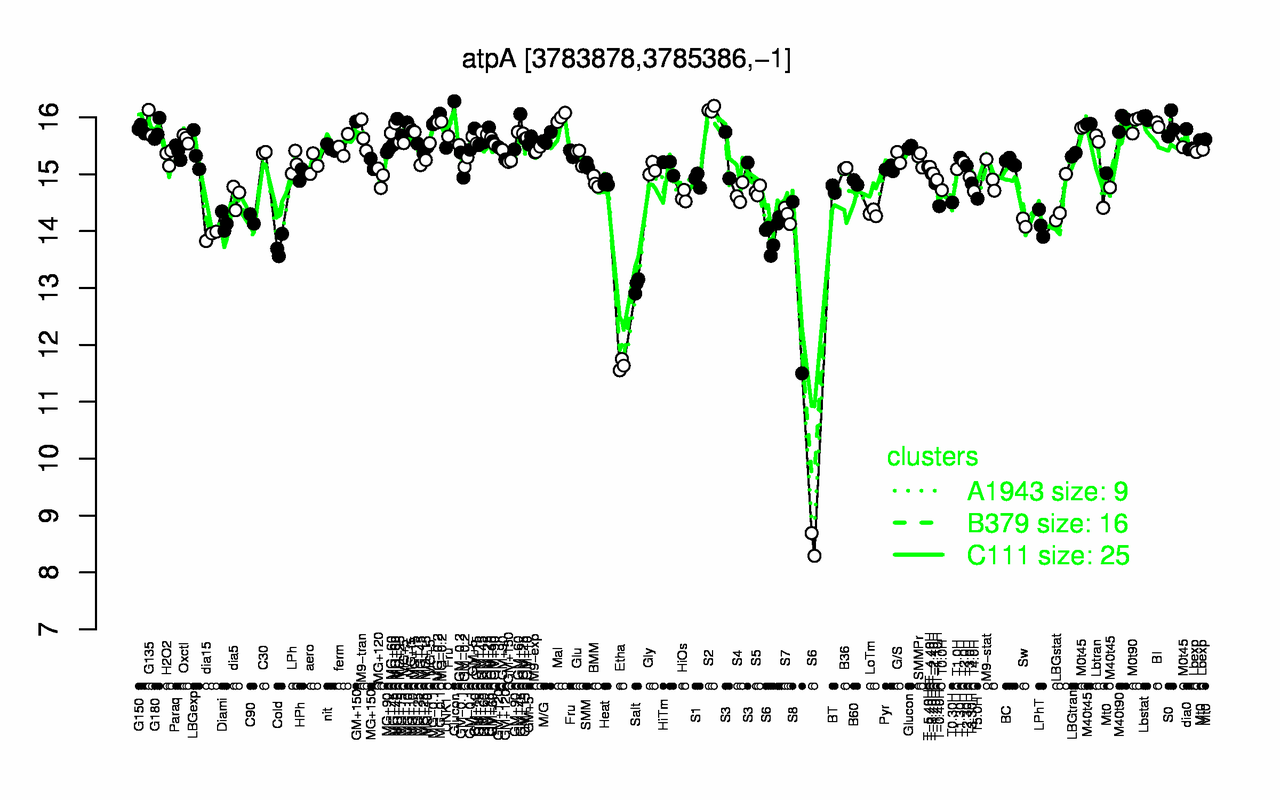
atpA
Locus Tag:
BSU36830
Details about atpA
Show/Hide
Highest Expression Conditions
S2
Mal
Lbstat
MG-0.1
MG-0.2
M40t90
G135
M0t90
BI
S0
16.1
16
16
16
15.9
15.9
15.9
15.9
15.9
15.9
Lowest Expression Conditions
Etha
S6
S8
Salt
Cold
dia15
LPhT
Sw
Diami
C90
11.6
12.8
13
13
13.7
13.9
14.1
14.1
14.2
14.2
Most Positively Correlated Segments
atpH
atpG
S1424
atpF
atpB
atpE
S1425
atpD
atpC
bdbD
0.99
0.98
0.98
0.97
0.96
0.96
0.95
0.94
0.79
0.78
Most Negatively Correlated Segments
ypuC
S1184
S273
S1158
S1556
S1054
S147
S318
ytvB
yybO
-0.76
-0.75
-0.71
-0.7
-0.67
-0.66
-0.66
-0.65
-0.65
-0.65
Expression Profile of Segment atpA
Show/Hide
Annotation of Gene atpA
Show/Hide
function
16.10: Respire
inference
ab initio prediction:AMIGene:2.0
codon_start
1
EC_number
3.6.3.14
transl_table
11
note
Evidence 1a: Function experimentally demonstrated in the studied strain; PubMedId: 15347741, 1655755, 8021203; Product type e: enzyme
db_xref
GI:2636208
product
ATP synthase (subunit alpha, component F1)
protein_id
CAB15700.1
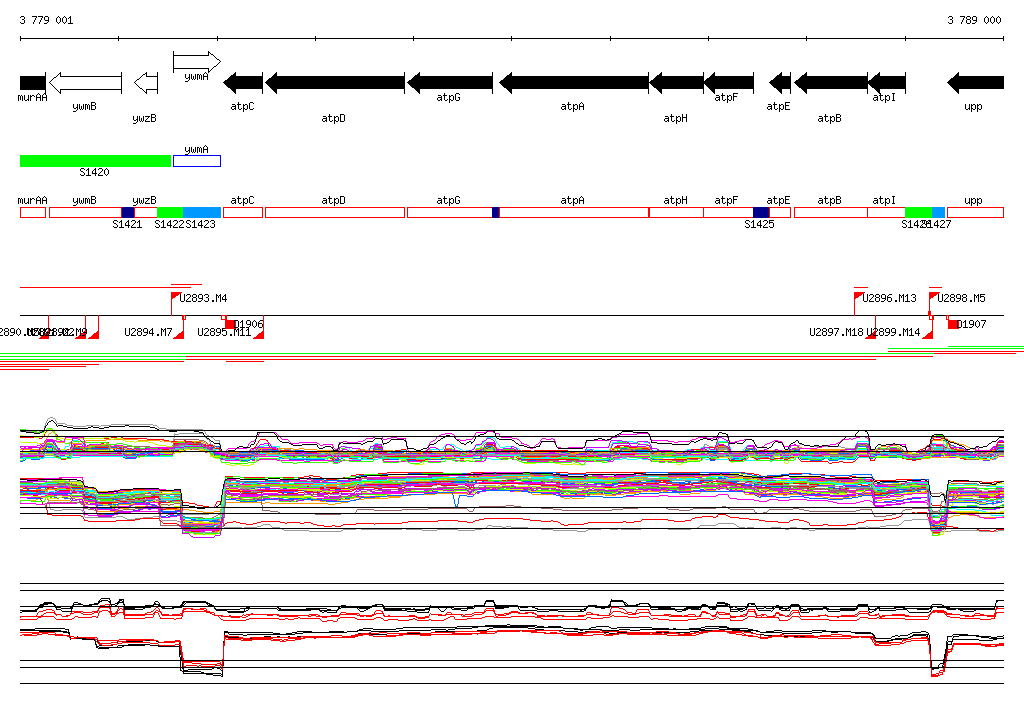
Genomic View of Gene/Segment atpA
Show/Hide
(Legend)
Browse Genome Context