| Start Page |
|
 |
| Start Page |
|
|
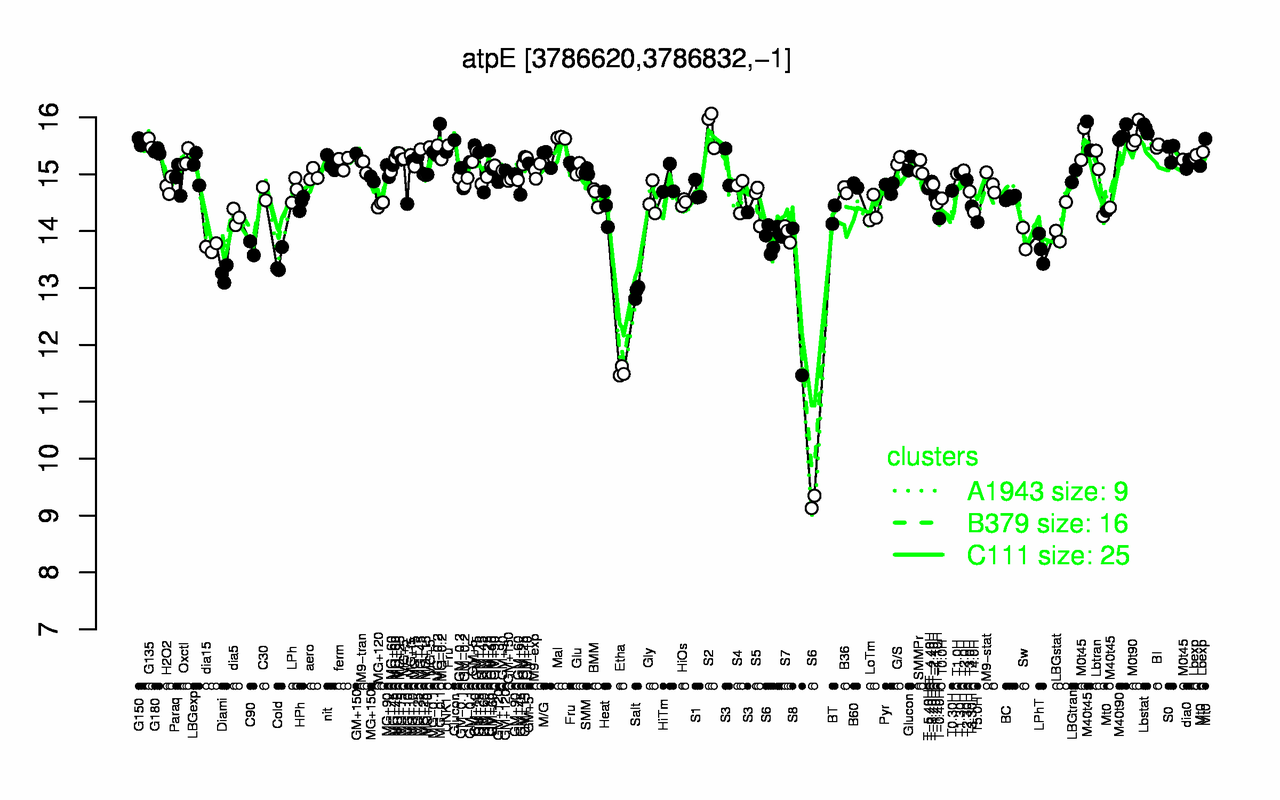
| S2 | Lbstat | M40t90 | M0t90 | Mal | G150 | G135 | MG-0.1 | BI | M0t45 |
| 15.8 | 15.8 | 15.7 | 15.7 | 15.6 | 15.6 | 15.5 | 15.5 | 15.5 | 15.4 |
| Etha | S8 | S6 | Salt | Diami | Cold | LPhT | C90 | dia15 | Sw |
| 11.5 | 12.8 | 12.9 | 12.9 | 13.3 | 13.5 | 13.7 | 13.7 | 13.7 | 13.9 |