| Start Page |
|
 |
| Start Page |
|
|
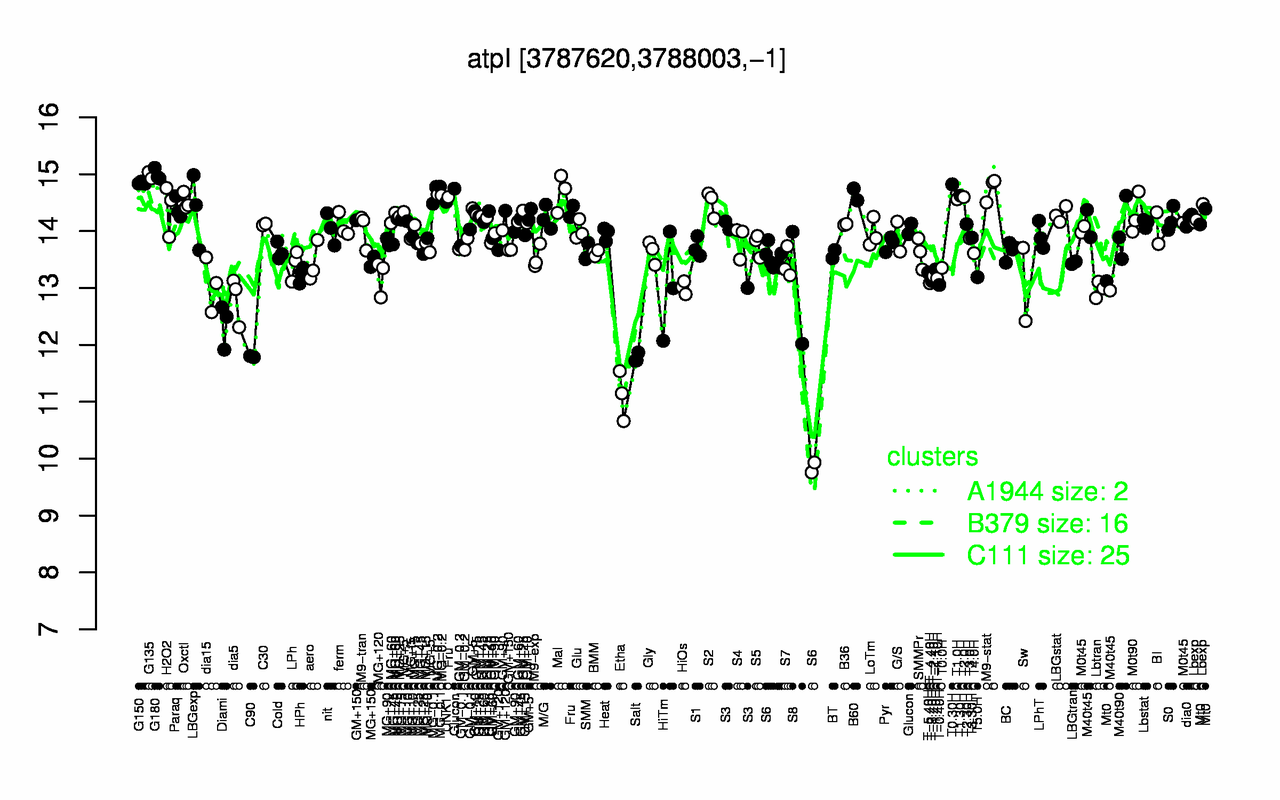
| G180 | G135 | G150 | T0.30H | M9-stat | Mal | MG-0.1 | B60 | MG-0.2 | T1.30H |
| 15 | 15 | 14.8 | 14.8 | 14.7 | 14.7 | 14.7 | 14.6 | 14.6 | 14.6 |
| Etha | Salt | C90 | Diami | S6 | dia5 | Lbtran | S8 | HiOs | HiTm |
| 11.1 | 11.8 | 11.8 | 12.4 | 12.7 | 12.8 | 13 | 13 | 13 | 13 |