| Start Page |
|
 |
| Start Page |
|
|
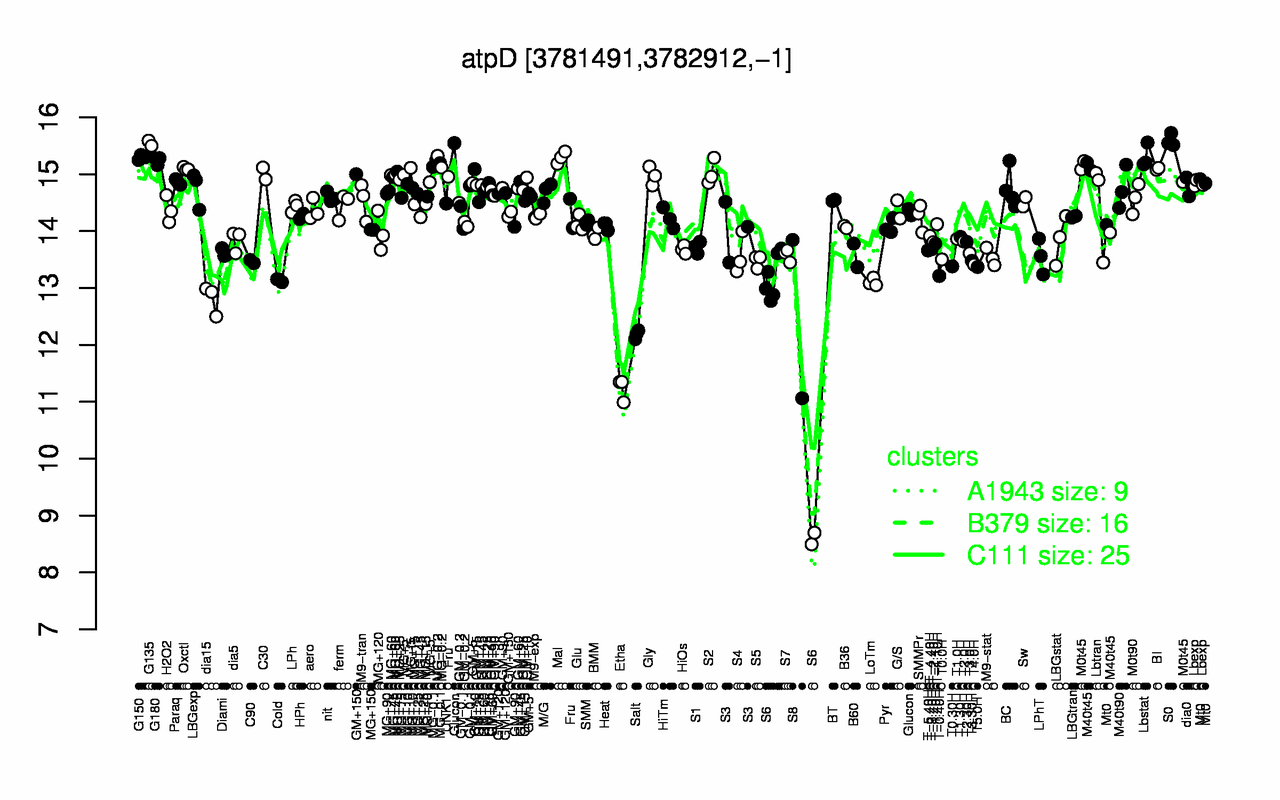
| S0 | G135 | Lbstat | G150 | Mal | G180 | MG-0.2 | MG-0.1 | MG+t5 | Oxctl |
| 15.6 | 15.5 | 15.3 | 15.3 | 15.3 | 15.2 | 15.2 | 15.2 | 15.1 | 15.1 |
| Etha | Salt | S6 | S8 | dia15 | LoTm | Cold | T-0.40H | T5.0H | T0.30H |
| 11.2 | 12.2 | 12.2 | 12.5 | 12.8 | 13.1 | 13.1 | 13.2 | 13.4 | 13.4 |