| Start Page |
|
 |
| Start Page |
|
|
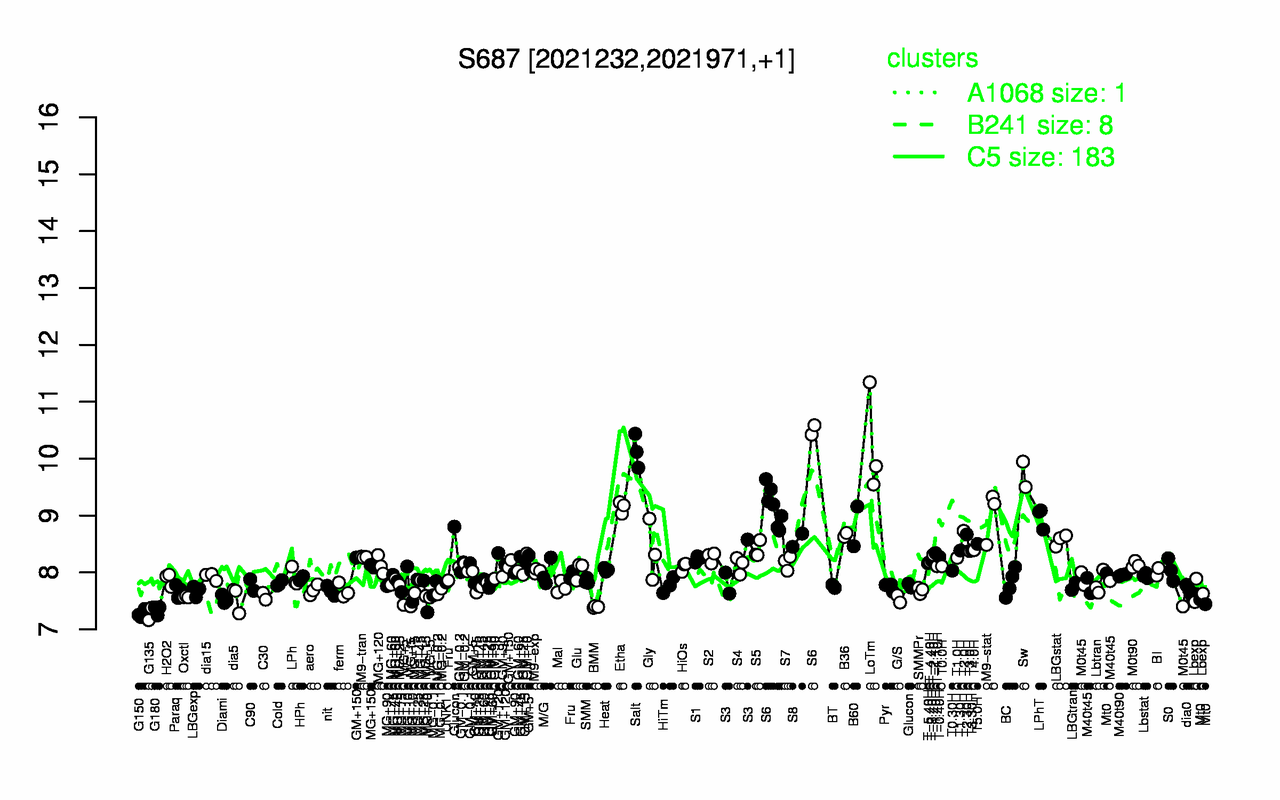
| LoTm | Salt | Sw | S6 | Etha | M9-stat | LPhT | B60 | T2.0H | T2.30H |
| 10.3 | 10.1 | 9.72 | 9.45 | 9.15 | 9.01 | 8.97 | 8.81 | 8.73 | 8.67 |
| G135 | G150 | G180 | BMM | MG+t5 | MG+5 | Diami | G/S | dia5 | Oxctl |
| 7.27 | 7.28 | 7.34 | 7.39 | 7.4 | 7.5 | 7.53 | 7.54 | 7.55 | 7.57 |