| Start Page |
|
 |
| Start Page |
|
|
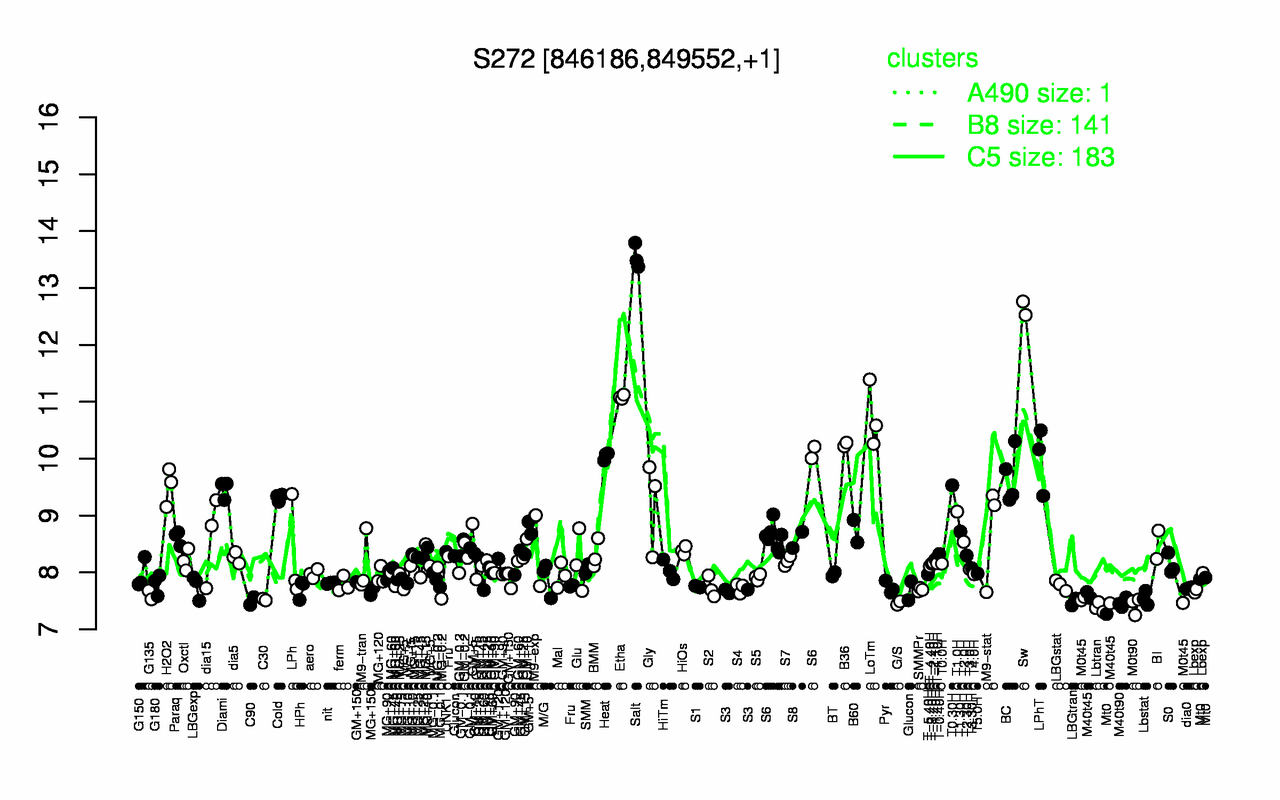
| Salt | Sw | Etha | LoTm | B36 | Heat | LPhT | BC | T0.30H | H2O2 |
| 13.5 | 12.6 | 11.1 | 10.7 | 10.2 | 10 | 10 | 9.69 | 9.53 | 9.52 |
| Lbtran | M0t90 | G/S | M40t90 | LBGtran | C90 | M0t45 | C30 | Lbstat | M40t45 |
| 7.39 | 7.42 | 7.46 | 7.47 | 7.48 | 7.5 | 7.51 | 7.52 | 7.55 | 7.55 |