| Start Page |
|
 |
| Start Page |
|
|
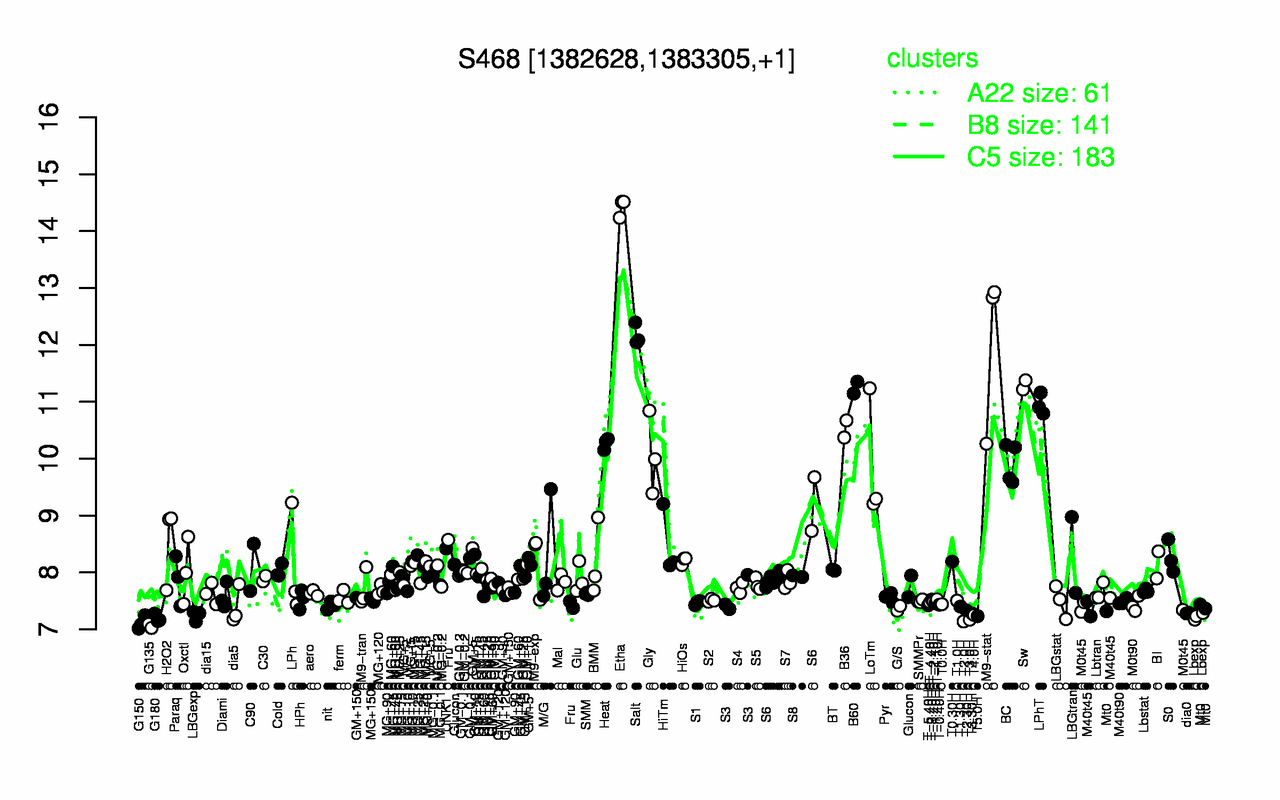
| Etha | Salt | M9-stat | Sw | B60 | LPhT | B36 | Heat | Gly | BC |
| 14.4 | 12.2 | 12 | 11.3 | 11.2 | 11 | 10.5 | 10.3 | 10.1 | 9.92 |
| G135 | G150 | T2.0H | T3.0H | G180 | Lbexp | T5.0H | LBGexp | T4.0H | dia0 |
| 7.06 | 7.11 | 7.14 | 7.17 | 7.19 | 7.23 | 7.23 | 7.24 | 7.25 | 7.28 |