B. subtilis Expression Data Browser
Start Page
B. subtilis Expression Data Browser
Gene/Segment:
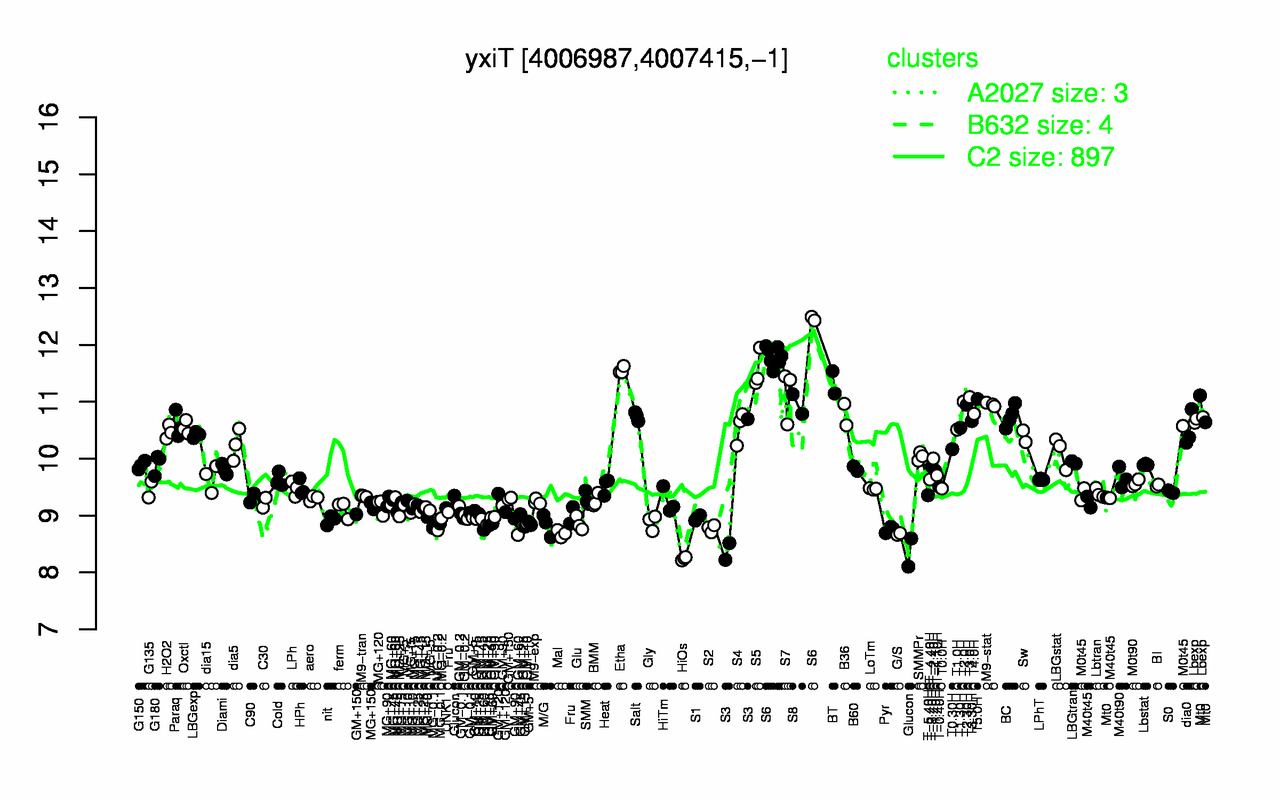
yxiT
Locus Tag:
BSU39029
Details about yxiT
Show/Hide
Highest Expression Conditions
S6
S5
Etha
BT
S7
T3.0H
T5.0H
T2.0H
S8
M9-stat
11.9
11.6
11.6
11.3
11.1
11.1
11
11
11
11
Lowest Expression Conditions
HiOs
G/S
Glucon
Mal
Pyr
GM+60
S2
MG-0.1
M/G
MG-0.2
8.24
8.68
8.68
8.68
8.76
8.76
8.78
8.82
8.83
8.85
Most Positively Correlated Segments
yxiT
S1504
S1158
ytvB
ywsA
yxjF
yteT
ykuD
ypbG
yflN
0.99
0.89
0.73
0.72
0.71
0.71
0.71
0.7
0.7
0.7
Most Negatively Correlated Segments
aroB
lytC
lytB
lytA
yopJ
aroF
aroE
pdxS
yhfT
yopI
-0.8
-0.78
-0.78
-0.77
-0.77
-0.76
-0.75
-0.74
-0.74
-0.74
Expression Profile of Segment yxiT
Show/Hide
Annotation of Gene yxiT
Show/Hide
inference
ab initio prediction:AMIGene:2.0
codon_start
1
pseudo
product
hypothetical protein
transl_table
11
note
Evidence 7: Gene remnant
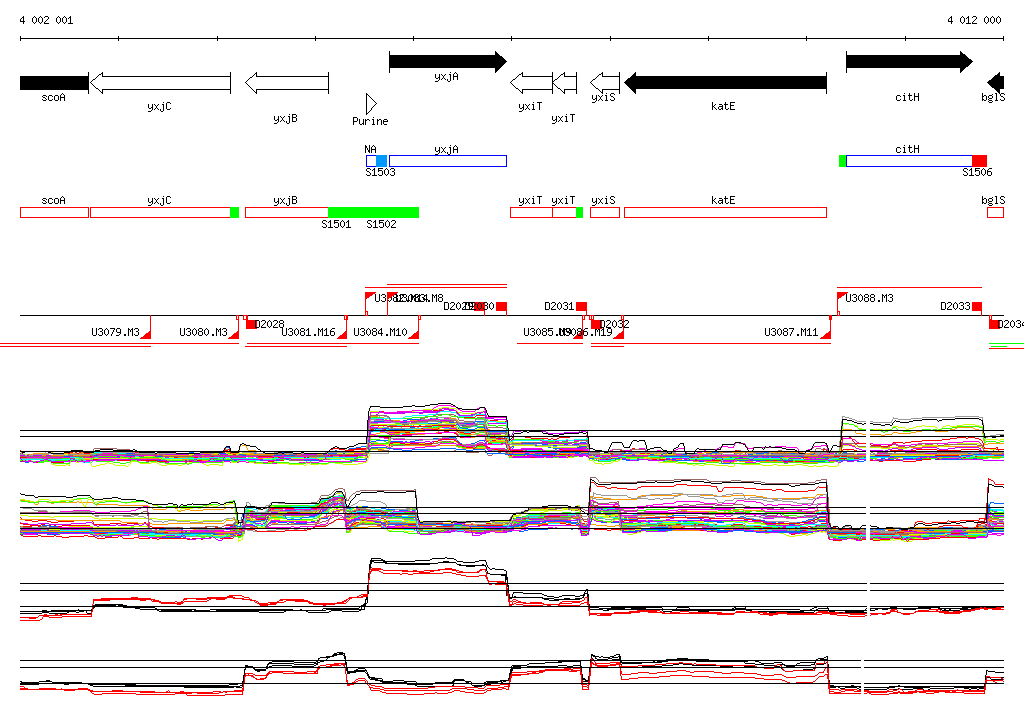
Genomic View of Gene/Segment yxiT
Show/Hide
(Legend)
Browse Genome Context