B. subtilis Expression Data Browser
Start Page
B. subtilis Expression Data Browser
Gene/Segment:
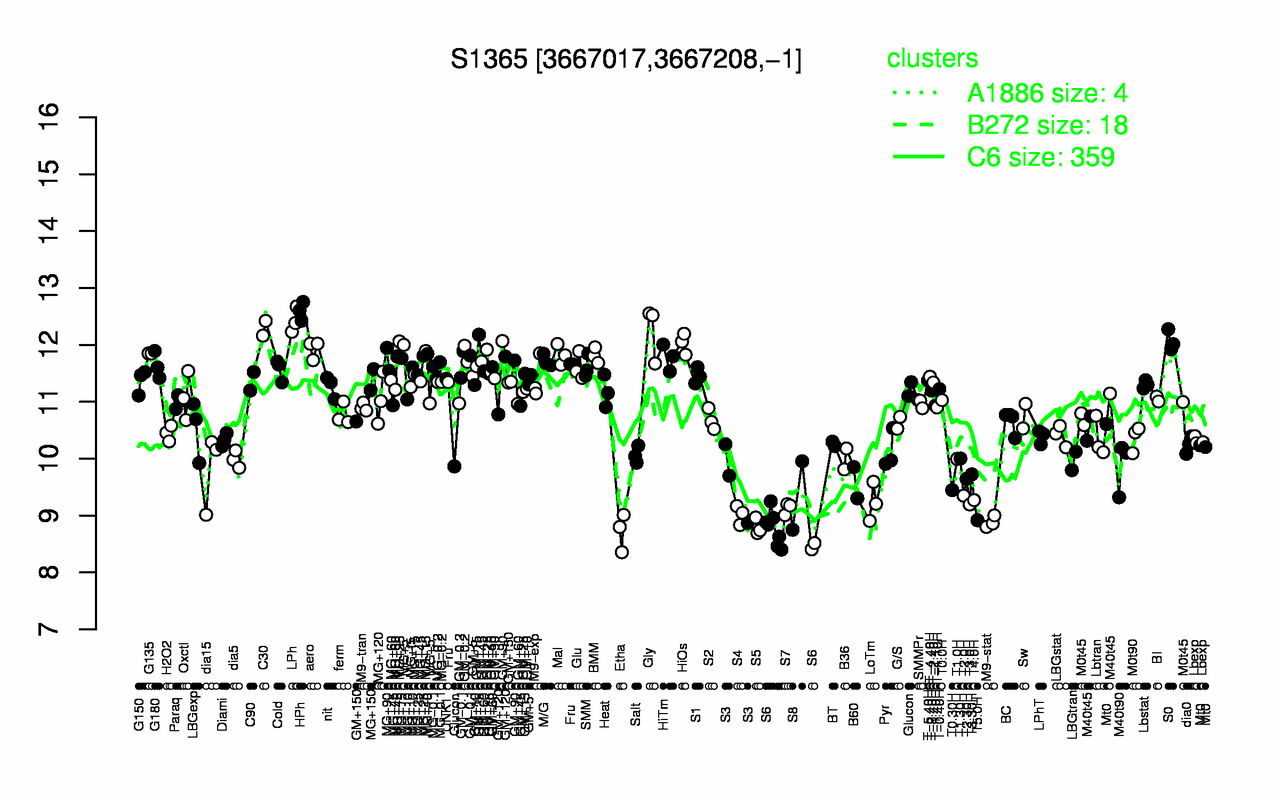
S1365
Locus Tag:
new_3667017_3667208_c
Details about S1365
Show/Hide
Highest Expression Conditions
HPh
LPh
C30
Gly
S0
HiOs
aero
G135
Mal
BMM
12.6
12.4
12.3
12.2
12.1
12
11.9
11.8
11.8
11.8
Lowest Expression Conditions
S6
Etha
S5
M9-stat
T5.0H
S4
S7
T3.0H
LoTm
T4.0H
8.7
8.72
8.8
8.89
8.92
9.02
9.13
9.2
9.24
9.27
Most Positively Correlated Segments
yvzH
S1364
ggaB
ggaA
S1366
ftsX
yvzI
NA
S1567
yxaI
0.96
0.93
0.93
0.84
0.81
0.8
0.78
0.77
0.76
0.76
Most Negatively Correlated Segments
yycN
yybI
S1158
pbpI
prpB
cwlD
yxiT
lonB
spoIISA
yhfN
-0.78
-0.77
-0.76
-0.76
-0.76
-0.75
-0.75
-0.74
-0.74
-0.74
Expression Profile of Segment S1365
Show/Hide
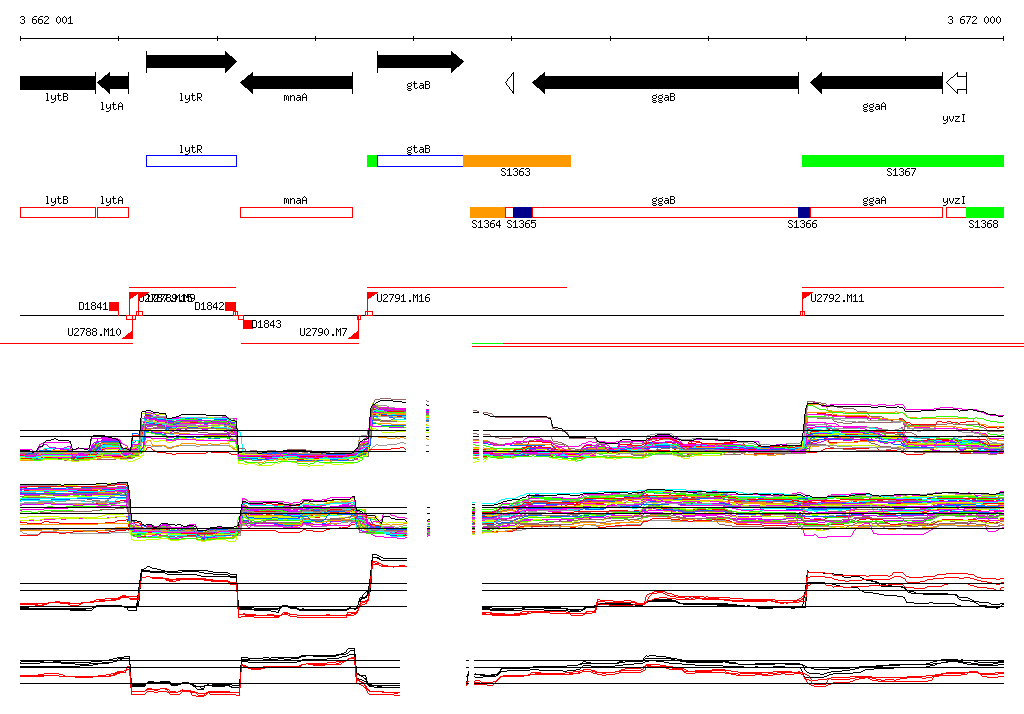
Genomic View of Gene/Segment S1365
Show/Hide
(Legend)
Browse Genome Context