| Start Page |
|
 |
| Start Page |
|
|
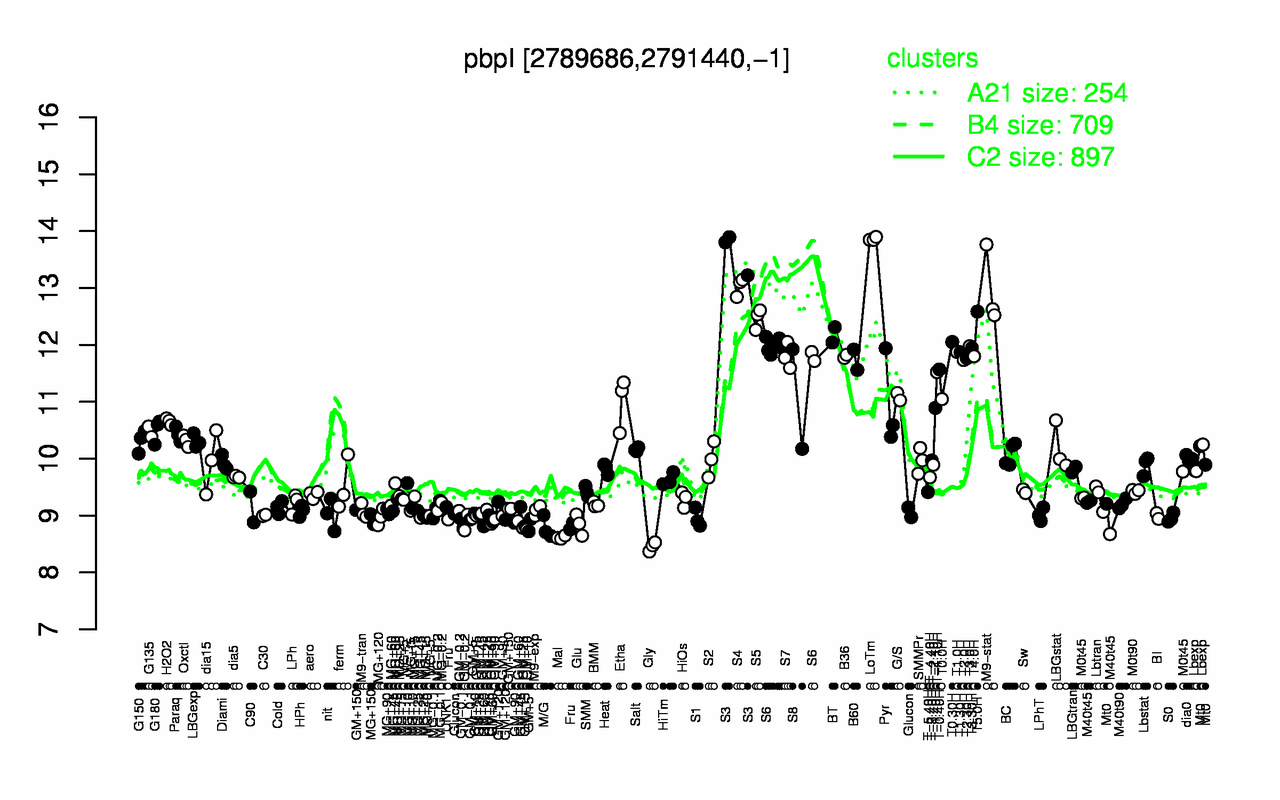
| LoTm | S3 | S4 | M9-stat | T5.0H | S5 | BT | T0.30H | T3.0H | T3.30H |
| 13.9 | 13.6 | 13 | 13 | 12.6 | 12.5 | 12.2 | 12.1 | 12 | 11.9 |
| Gly | Mal | M/G | Glu | Fru | GM+60 | GM+5 | GM-0.1 | GM+10 | GM+90 |
| 8.46 | 8.62 | 8.79 | 8.84 | 8.85 | 8.87 | 8.87 | 8.88 | 8.9 | 8.93 |