B. subtilis Expression Data Browser
Start Page
B. subtilis Expression Data Browser
Gene/Segment:
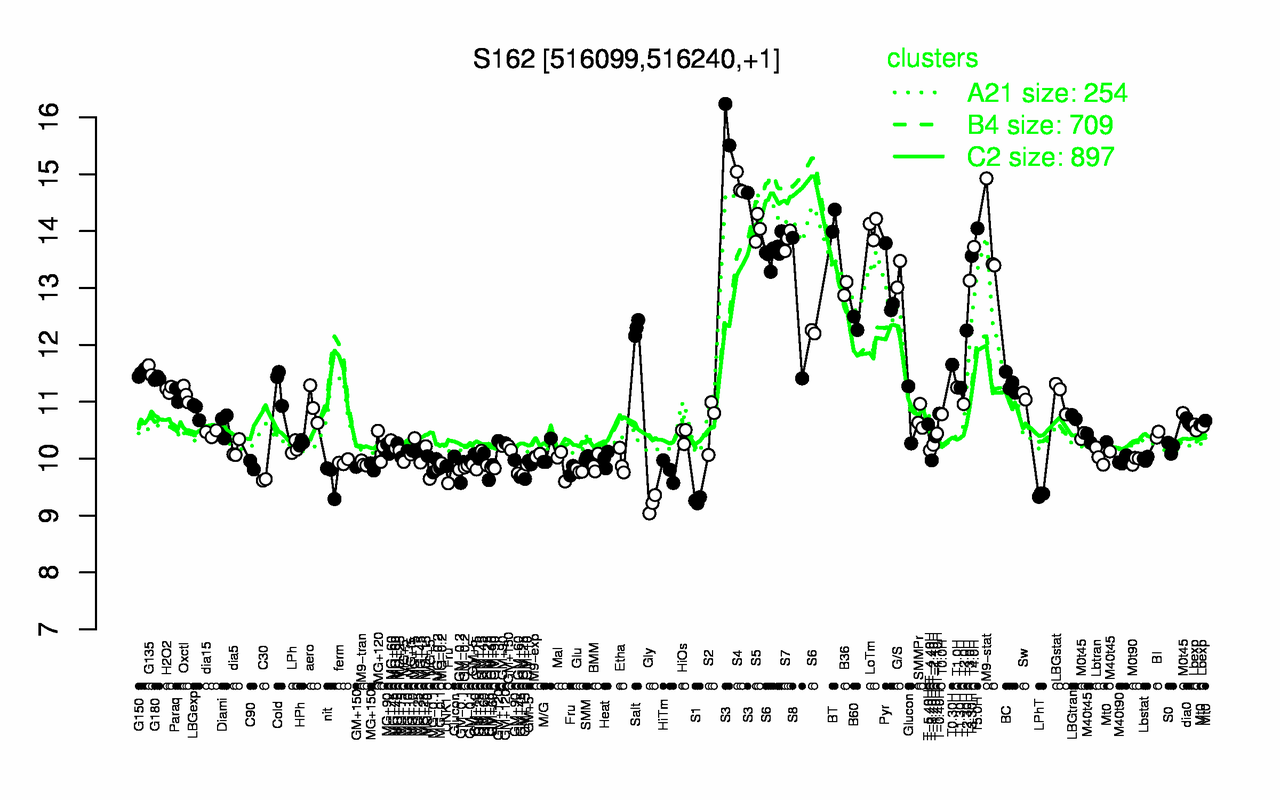
S162
Locus Tag:
new_516099_516240
Details about S162
Show/Hide
Highest Expression Conditions
S3
S4
BT
LoTm
S5
T5.0H
M9-stat
S7
T4.0H
T3.30H
15.5
14.8
14.2
14.1
14.1
14
13.9
13.8
13.7
13.6
Lowest Expression Conditions
Gly
S1
LPhT
C30
nit
GM+15
Fru
HiTm
Glu
MG+5
9.21
9.27
9.37
9.63
9.64
9.69
9.71
9.78
9.79
9.8
Most Positively Correlated Segments
ydcC
spoVD
spmA
spoIVFA
gerM
spoIVFB
spmB
ykvU
dacB
spoIIIAD
0.99
0.95
0.94
0.94
0.93
0.93
0.93
0.93
0.93
0.92
Most Negatively Correlated Segments
cheC
flhA
cheW
cheD
sigD
ylxH
flhF
S1129
cheA
cheB
-0.81
-0.81
-0.81
-0.81
-0.81
-0.81
-0.81
-0.8
-0.8
-0.8
Expression Profile of Segment S162
Show/Hide
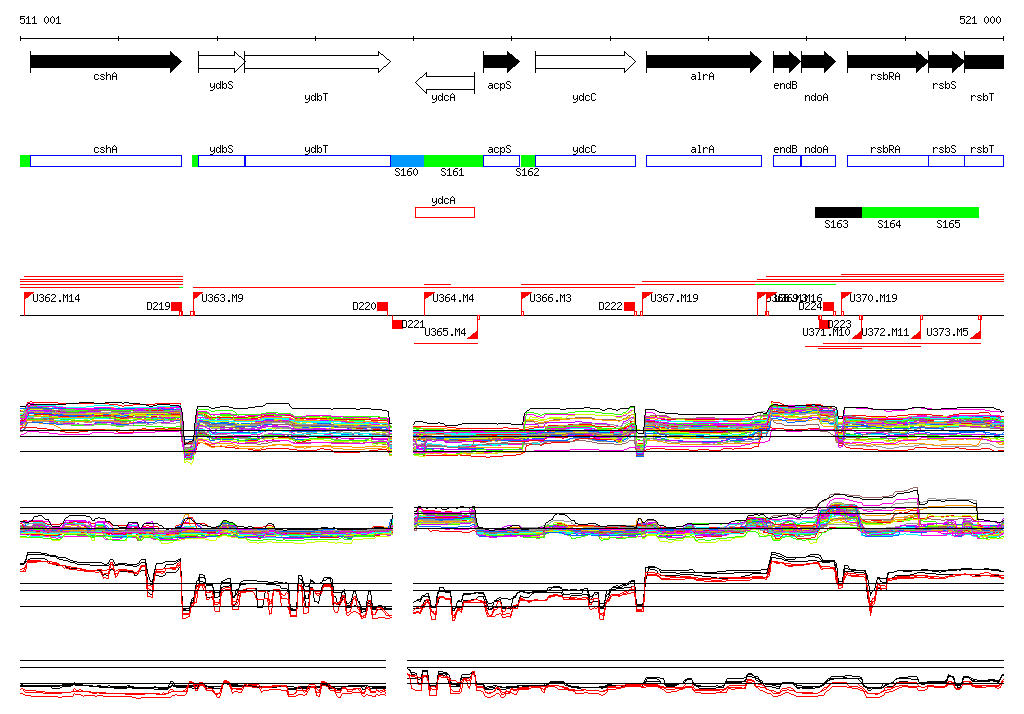
Genomic View of Gene/Segment S162
Show/Hide
(Legend)
Browse Genome Context