| Start Page |
|
 |
| Start Page |
|
|
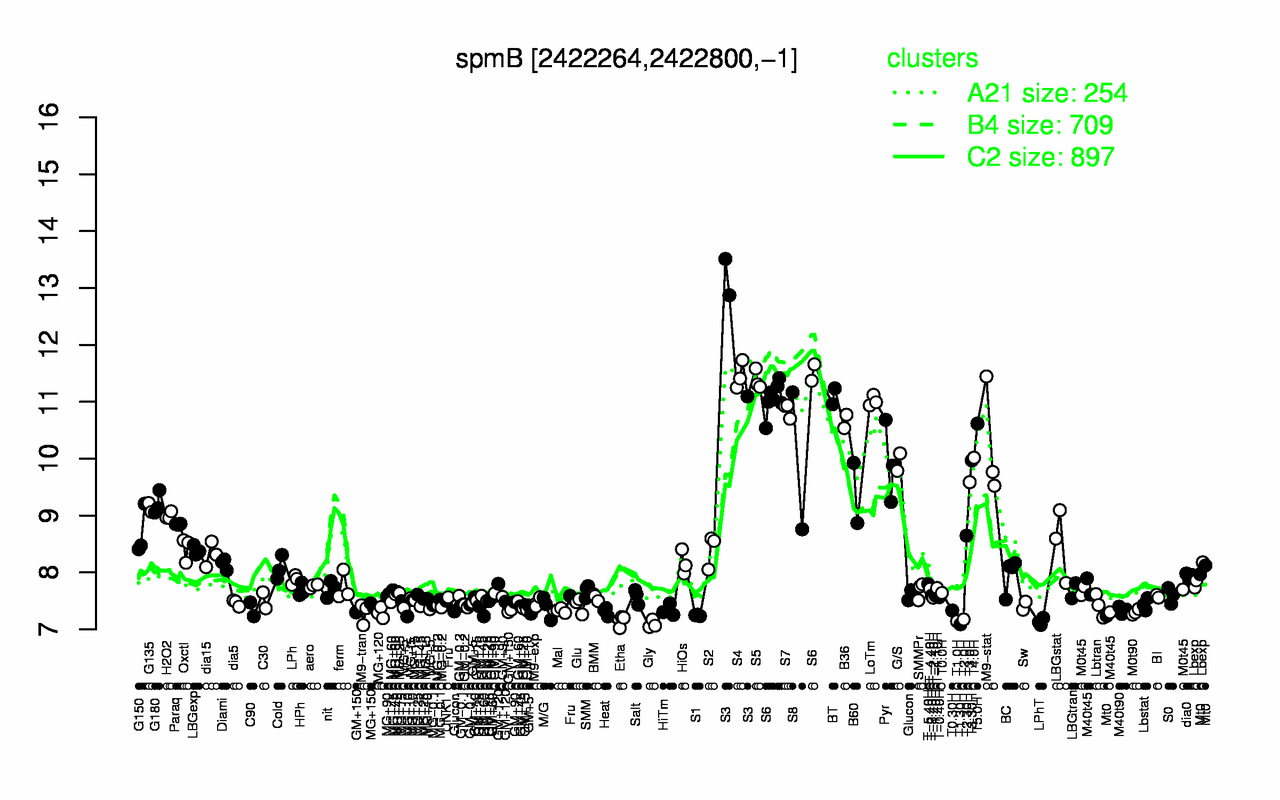
| S3 | S4 | S5 | S6 | BT | LoTm | S7 | B36 | T5.0H | M9-stat |
| 12.5 | 11.5 | 11.4 | 11.2 | 11.1 | 11 | 10.9 | 10.7 | 10.6 | 10.2 |
| T1.30H | Gly | LPhT | T1.0H | Etha | T2.0H | S1 | M9-tran | MG+120 | M0t90 |
| 7.09 | 7.09 | 7.13 | 7.14 | 7.15 | 7.17 | 7.25 | 7.29 | 7.29 | 7.3 |