| Start Page |
|
 |
| Start Page |
|
|
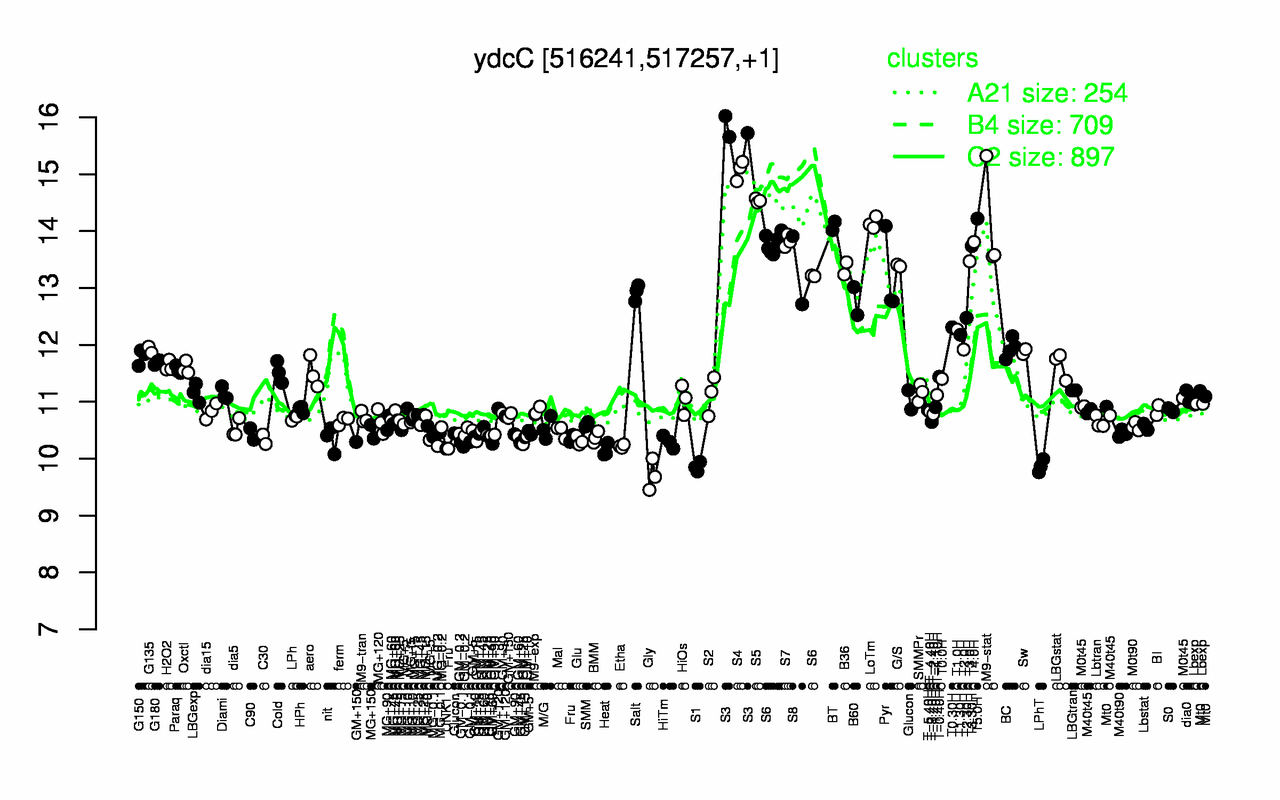
| S3 | S4 | S5 | T5.0H | M9-stat | LoTm | BT | S7 | T4.0H | T3.30H |
| 15.8 | 15.1 | 14.5 | 14.2 | 14.2 | 14.1 | 14.1 | 13.8 | 13.8 | 13.7 |
| Gly | S1 | LPhT | Heat | UNK1 | Etha | GM-0.1 | HiTm | Fru | Glu |
| 9.71 | 9.86 | 9.87 | 10.1 | 10.2 | 10.2 | 10.3 | 10.3 | 10.3 | 10.3 |