| Start Page |
|
 |
| Start Page |
|
|
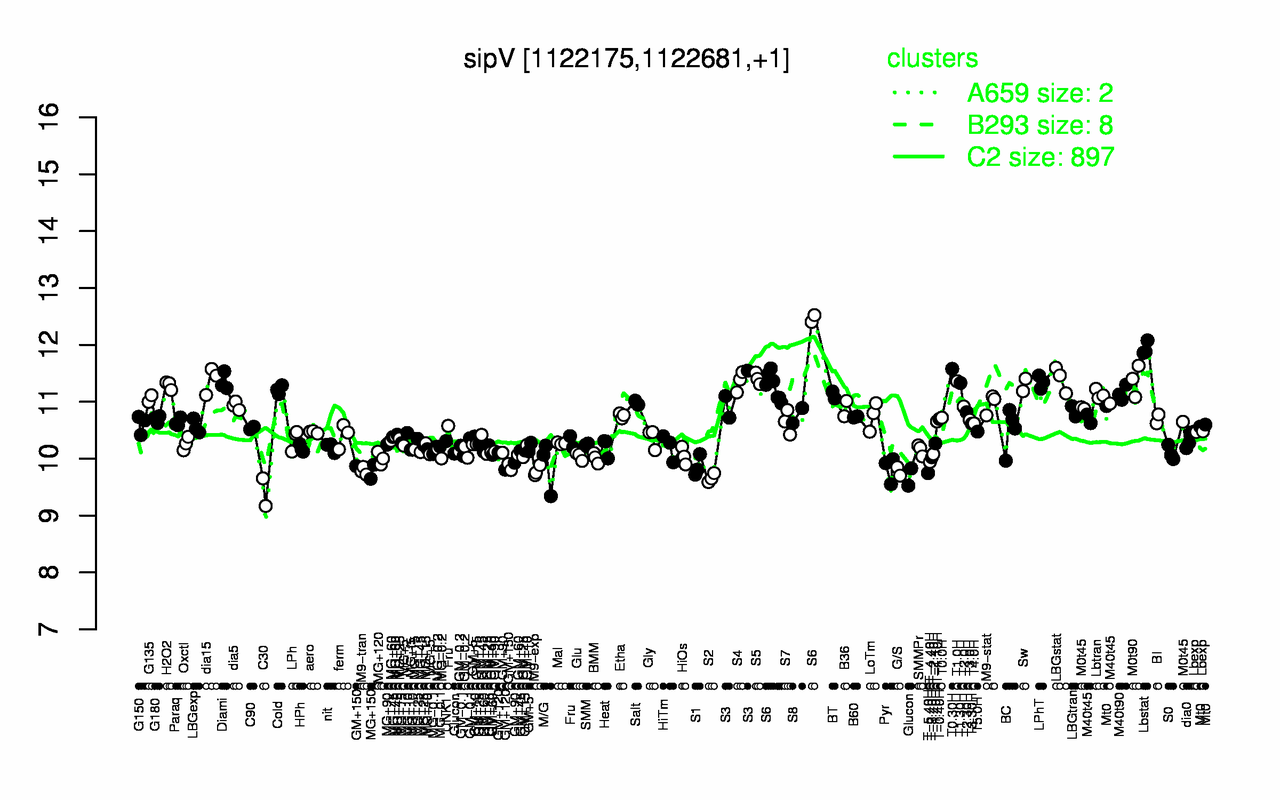
| Lbstat | T0.30H | S6 | S5 | LBGstat | dia15 | M0t90 | T1.0H | S4 | Diami |
| 11.9 | 11.6 | 11.5 | 11.4 | 11.4 | 11.4 | 11.4 | 11.4 | 11.4 | 11.4 |
| C30 | S2 | T-5.40H | MG+150 | G/S | M9-exp | M9-tran | Glucon | Pyr | GM+150 |
| 9.41 | 9.66 | 9.75 | 9.77 | 9.78 | 9.78 | 9.78 | 9.81 | 9.82 | 9.86 |