B. subtilis Expression Data Browser
Start Page
B. subtilis Expression Data Browser
Gene/Segment:
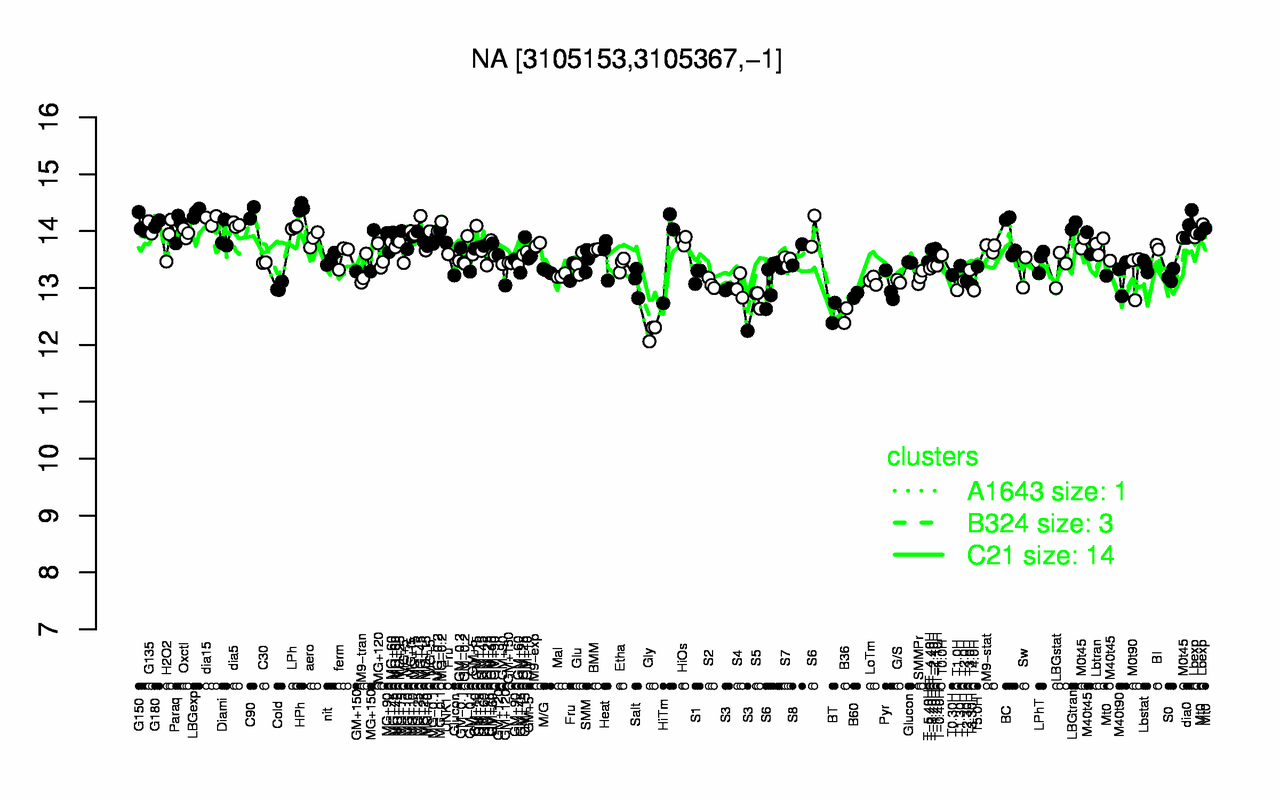
NA
Locus Tag:
BSU_misc_RNA_49
Details about NA
Show/Hide
Highest Expression Conditions
HPh
C90
LBGexp
dia15
G180
G150
dia0
dia5
LBGtran
MG-0.2
14.4
14.3
14.3
14.2
14.1
14.1
14.1
14.1
14.1
14.1
Lowest Expression Conditions
Gly
B36
BT
S3
S5
B60
T4.0H
T1.0H
Pyr
Cold
12.2
12.5
12.6
12.7
12.8
12.9
13
13
13
13
Most Positively Correlated Segments
yddQ
NA
yddN
lrpA
S839
ywzC
NA
S426
NA
ypsA
0.72
0.72
0.68
0.67
0.67
0.67
0.66
0.66
0.66
0.66
Most Negatively Correlated Segments
rapA
phrA
yxbB
aslA
S1534
yxbC
yxnB
qcrA
S653
ykfA
-0.67
-0.67
-0.64
-0.63
-0.63
-0.63
-0.61
-0.61
-0.61
-0.6
Expression Profile of Segment NA
Show/Hide
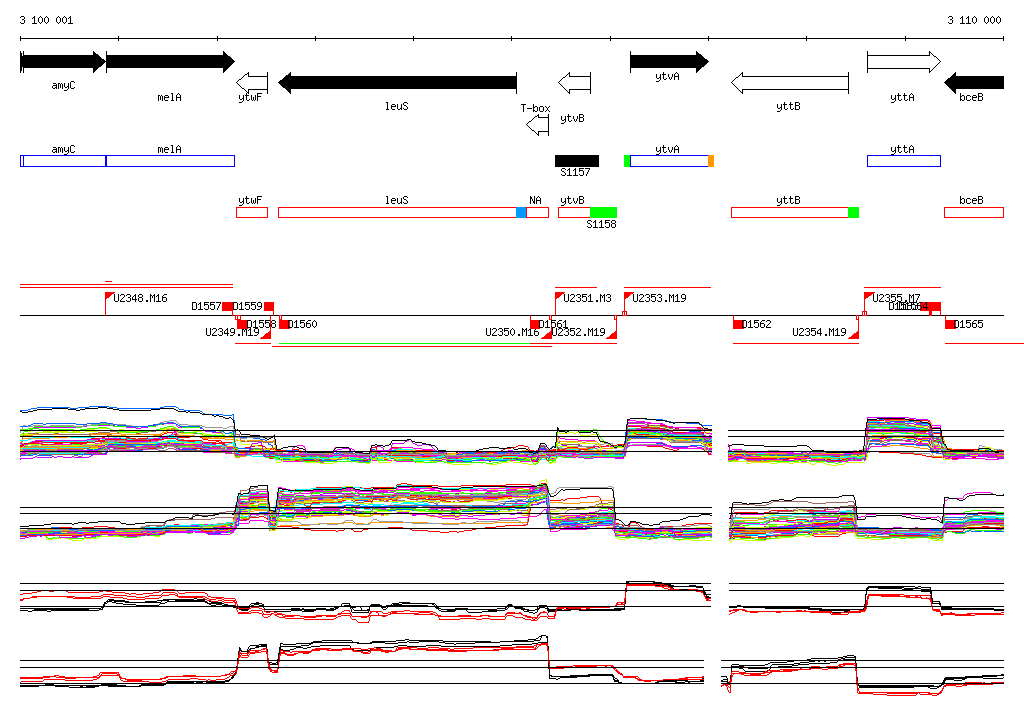
Genomic View of Gene/Segment NA
Show/Hide
(Legend)
Browse Genome Context