| Start Page |
|
 |
| Start Page |
|
|
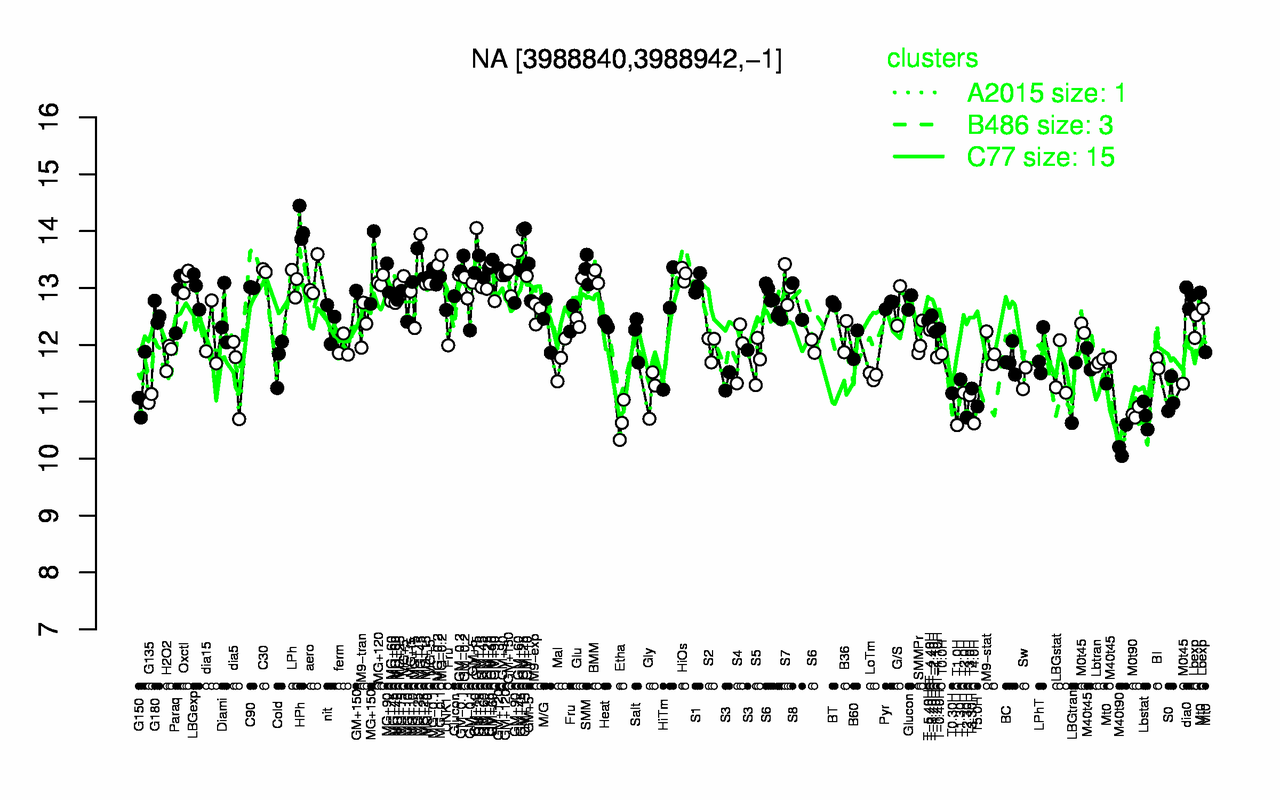
| HPh | GM+15 | GM+25 | MG-0.2 | GM+60 | MG+150 | SMM | MG+25 | C30 | GM+120 |
| 14.1 | 13.8 | 13.5 | 13.5 | 13.4 | 13.4 | 13.3 | 13.3 | 13.3 | 13.3 |
| M40t90 | T1.0H | T4.0H | Etha | T2.30H | Lbstat | M0t90 | T5.0H | G135 | S0 |
| 10.3 | 10.6 | 10.6 | 10.7 | 10.7 | 10.8 | 10.8 | 10.9 | 11.1 | 11.1 |