| Start Page |
|
 |
| Start Page |
|
|
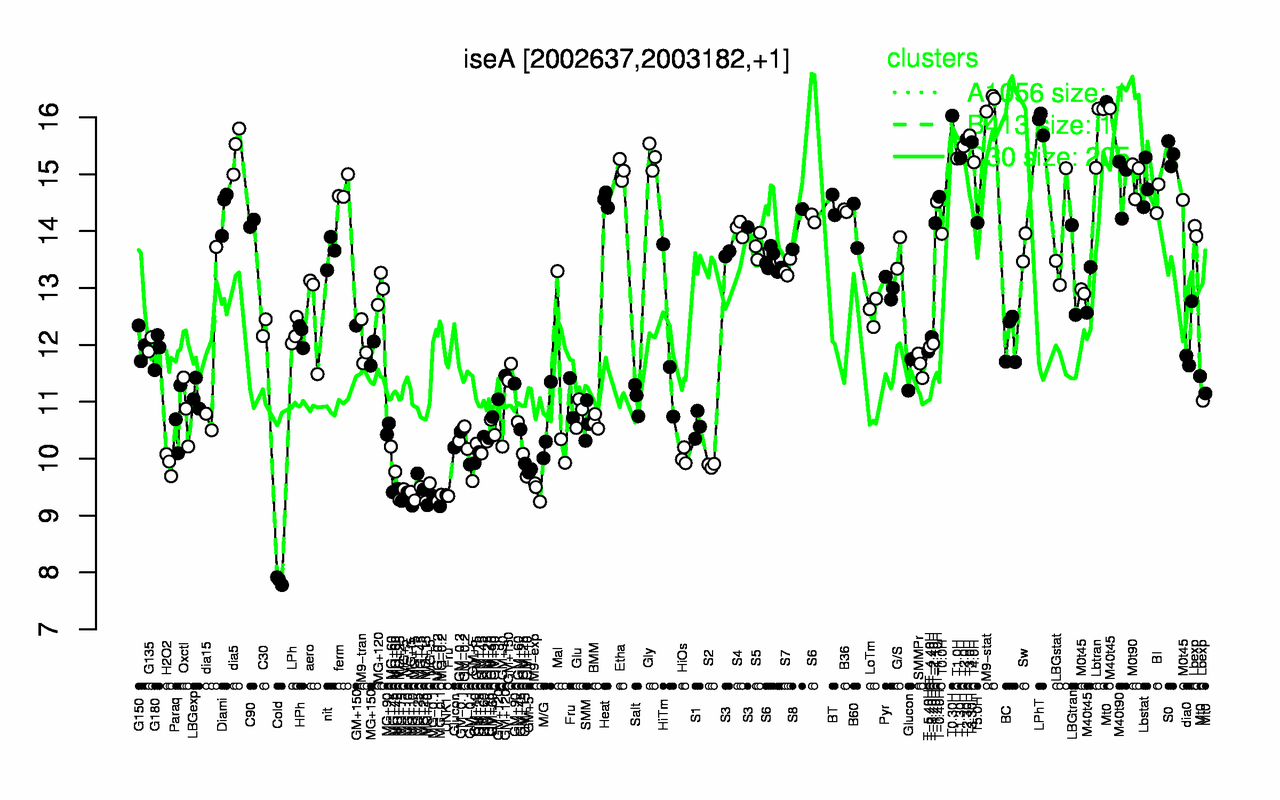
| M9-stat | T0.30H | LPhT | Lbtran | T3.0H | T2.30H | T3.30H | T2.0H | dia5 | S0 |
| 16.3 | 16 | 15.9 | 15.8 | 15.7 | 15.6 | 15.6 | 15.5 | 15.4 | 15.4 |
| Cold | MG+10 | MG+15 | MG-0.1 | MG-0.2 | UNK1 | MG+t5 | M9-exp | MG+45 | MG+25 |
| 7.86 | 9.26 | 9.26 | 9.26 | 9.31 | 9.36 | 9.42 | 9.44 | 9.46 | 9.49 |