| Start Page |
|
 |
| Start Page |
|
|
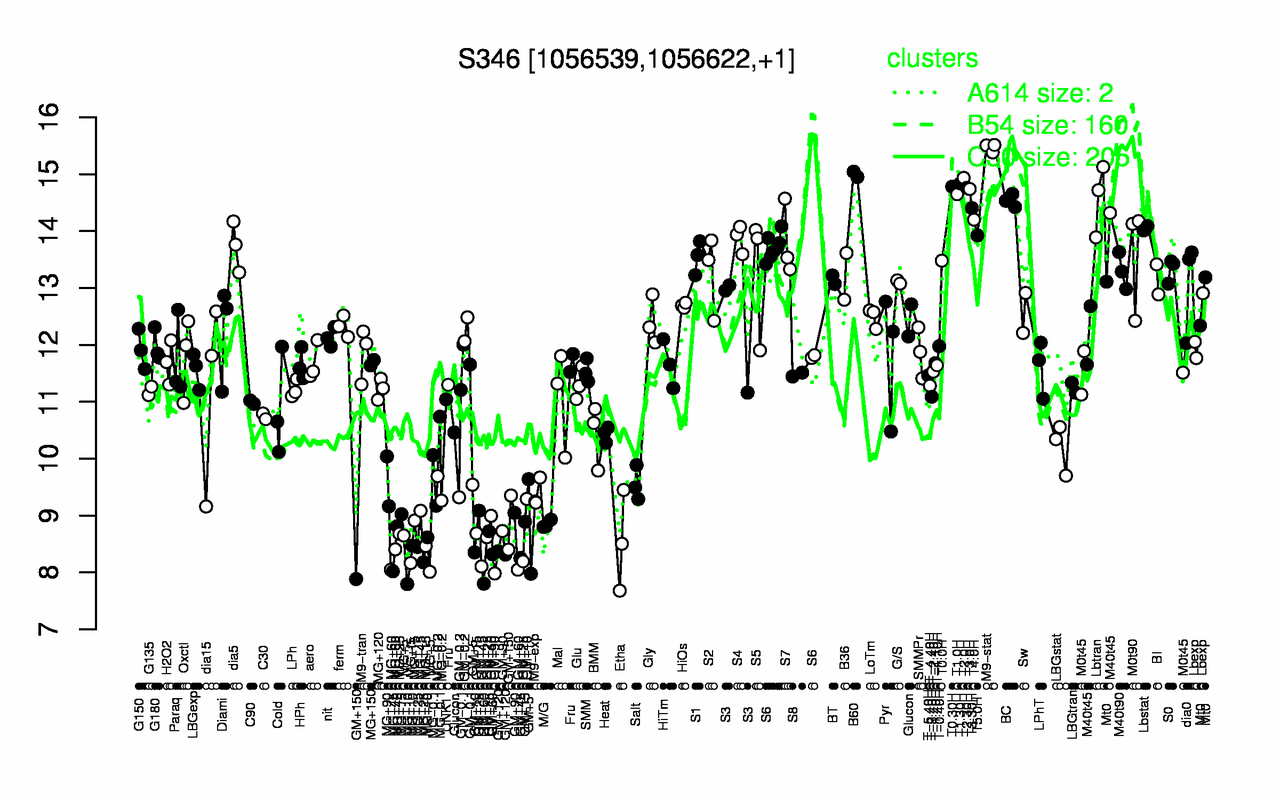
| M9-stat | B60 | T2.0H | T1.30H | T0.30H | T2.30H | T3.0H | T1.0H | Lbtran | BC |
| 15.5 | 15 | 14.9 | 14.8 | 14.8 | 14.8 | 14.7 | 14.6 | 14.6 | 14.5 |
| GM+60 | MG+t5 | MG+60 | MG+10 | MG+5 | GM+120 | MG+25 | GM+45 | Etha | GM+150 |
| 8.06 | 8.17 | 8.23 | 8.29 | 8.33 | 8.34 | 8.44 | 8.45 | 8.54 | 8.55 |