| Start Page |
|
 |
| Start Page |
|
|
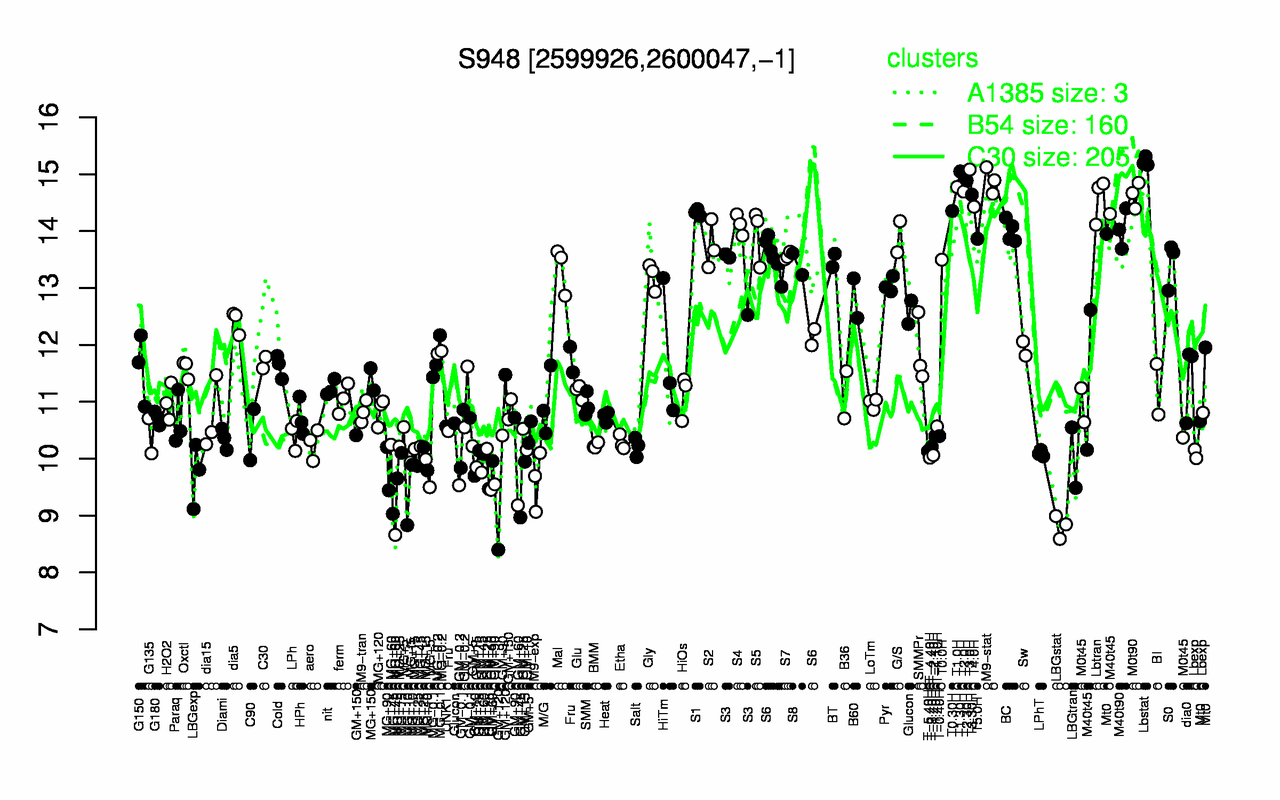
| Lbstat | T3.0H | T1.30H | M9-stat | T2.30H | T1.0H | T2.0H | T3.30H | M0t90 | Lbtran |
| 15.2 | 15.1 | 15 | 14.9 | 14.9 | 14.8 | 14.7 | 14.6 | 14.6 | 14.6 |
| LBGstat | GM+45 | MG+60 | MG+10 | M9-exp | MG+45 | LBGexp | GM+60 | GM+15 | MG+90 |
| 8.81 | 9.39 | 9.45 | 9.51 | 9.62 | 9.63 | 9.72 | 9.74 | 9.76 | 9.82 |