| Start Page |
|
 |
| Start Page |
|
|
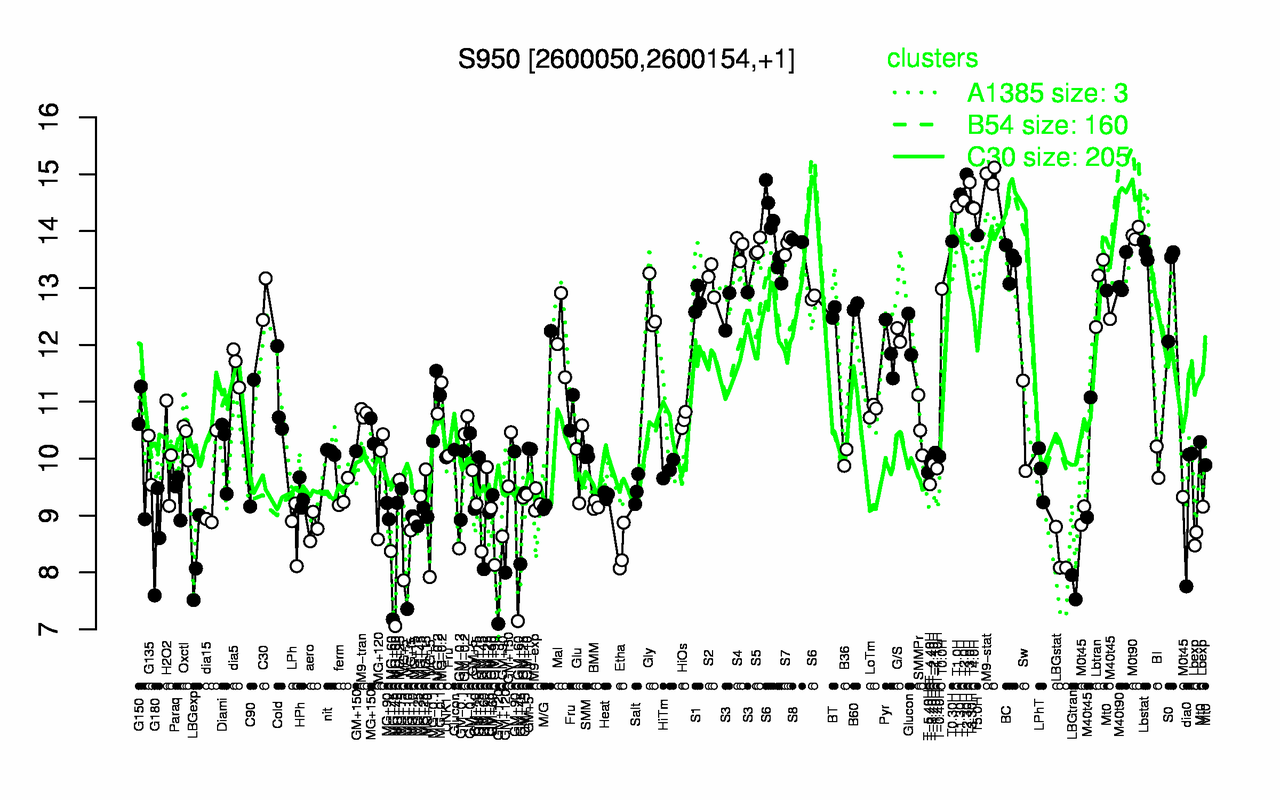
| T2.30H | M9-stat | T3.0H | T1.30H | T2.0H | T1.0H | T3.30H | T4.0H | M0t90 | T5.0H |
| 15 | 15 | 14.9 | 14.6 | 14.5 | 14.4 | 14.4 | 14.4 | 14 | 13.9 |
| GM+120 | MG+60 | LBGtran | MG+5 | GM+60 | LBGexp | LBGstat | Etha | MG+10 | GM+45 |
| 7.55 | 7.72 | 7.74 | 7.89 | 8.19 | 8.2 | 8.32 | 8.39 | 8.44 | 8.55 |